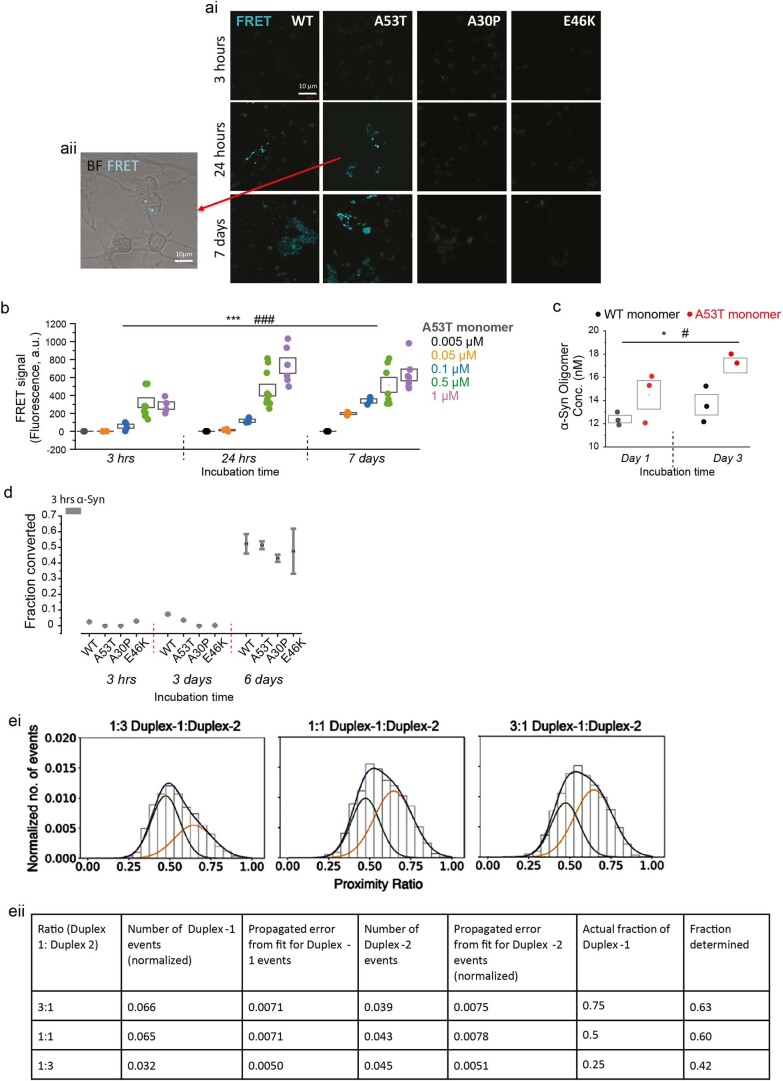
Extended Data Fig. 2. Related to main Fig. 1.
(ai,aii) Representative brightfield (BF) and confocal images of FRET signal induced by application of WT or mutant α-Syn in main Fig. 1d. (b) Intracellular FRET signal induced by A53T α-Syn monomers occurred in a concentration- and time-dependent manner (n = 3, 6 or 10 fields imaged over 2 or 4 independent experiments; more experiments were performed with the concentrations that produced higher FRET signal). (c) Higher oligomer concentration was measured in A53T monomer-treated cells compared to WT-treated cells after 3 days of incubation. Concentration was measured using a Human Synuclein, alpha (non A4 component of amyloid precursor) oligomer (SNCA oligomer) ELISA kit (CSB-E18033h, Generon) (n = 3 independent experiments). (d) fitting error for main Fig. 1f. Data are represented as mean ± SD. (ei) FRET histograms of different ratios of duplexes analyzed using single-molecule confocal microscopy. (eii) Number and the fraction of detected species for different mixtures of Duplex-1 and Duplex-2. Note. Data are represented as Data ± SEM (box). *#p < 0.05, **##p < 0.005, ***###p < 0.0005. Detailed statistical information is provided in Supplementary Table 1.

