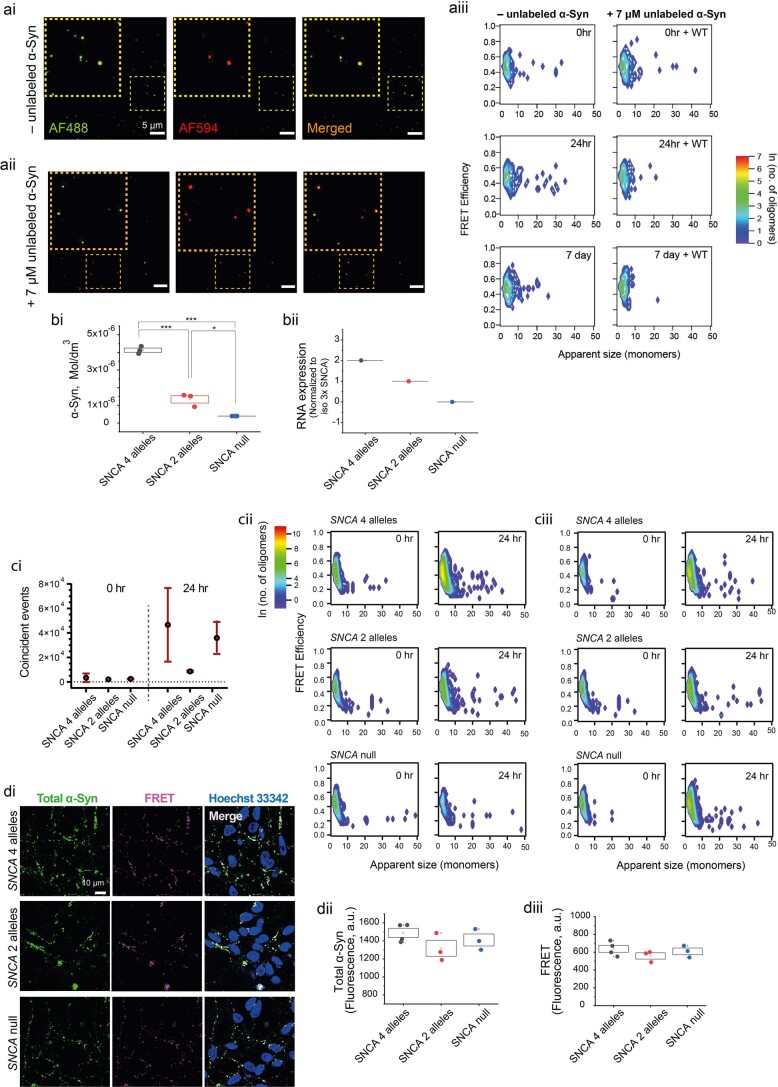
Extended Data Fig. 4. Related to main Fig. 1.
(a) Formation of aggregates detected by FRET is not affected by unlabeled α-Syn. (ai & ii) Representative TIRF images of labeled recombinant A53T oligomers (formed after 7 days aggregation) that were formed in the absence (ai) and presence (aii) of 7 μM unlabeled wildtype (WT) α-Syn show that the presence of unlabeled protein has no effect on aggregate formation (n = 2 independent experiments) (aiii) Size and FRET distributions of oligomers detected using single-molecule confocal microscopy when labeled α-Syn aggregates in the absence (left) or presence (right) of 7 μM unlabeled WT α-Syn. (b-d) Concentrations of endogenous α-Syn did not affect aggregation kinetics measured by single-molecule (sm) FRET. (bi & ii) Allelic series of iPSC lines display different levels of α-Syn using Human Synuclein monomer ELISA kit (bi; n = 3 independent experiments), and SNCA mRNA by qPCR (bii; average of three wells, n = 1 independent experiment). (c) A53T-AF488 and AF-594 monomers (total 1 μM) were added to the three iPSC derived neurons and smFRET was performed on the cell lysates. (ci) Analysis of total FRET (coincident) events for the iPSC lines demonstrate non-significant higher mean events for SNCA 4 alleles at 24 hours, data shown as mean ± SD. (cii & iii) 2D contour plots from smFRET measurements of cell lysates show no difference in FRET efficiencies across the three cell lines, indicating aggregates formed in cells with different levels of the endogenous α-Syn show negligibe difference in FRET efficiency. (cii) and (ciii) show two separate replicates. (di-iii) FRET measurements obtained 24 hours after A53T-AF488 and AF594 monomer treatment show there is no difference in total α-Syn uptake (dii) and FRET intensity (diii) across the cells with different endogenous SNCA expression levels (n = 3 or 4 independent experiments). Experiments were performed at an early timepoint post differentiation day 50. Note. Data are represented as Data ± SEM (box) unless mentioned. ***p < 0.0005. Detailed statistical information is provided in Supplementary Table 1.

