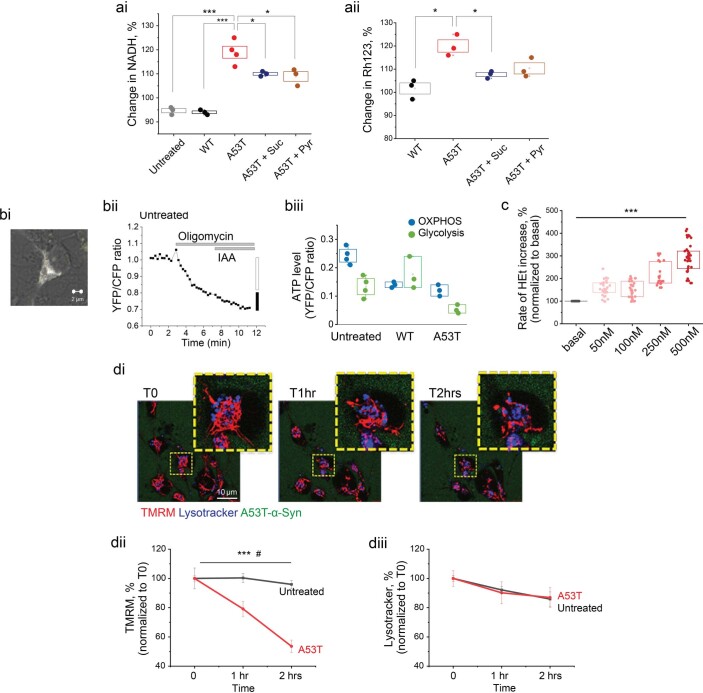
Extended Data Fig. 8. Related to main Fig. 5.
(ai & ii) Quantitative histograms referring to Fig. 4a and b respectively Suc; DMsuccinate, Pyr; Pyruvate, Rh123; Rhodamine 123. (ai) A53T vs untreated or WT or A53T + Suc or A53T + Pyr (n = 3 or 4 fields imaged over 2 independent experiments). (aii) A53T vs WT or A53T + Suc (n = 3 independent experiments) (bi) Representative image of transfected cells with ATP probe. (bii) Representative trace of ATP measurement in untreated cells. (biii) The proportional contribution of oxidative phosphorylation (OXPHOS) and glycolysis to ATP levels in untreated, WT or A53T treated cells, shown in main Fig. 5eiii. (c) Superoxide is produced in a concentration dependent manner from A53T-α-Syn monomer (n = 32, 34 or 37 cells over 2 independent experiments). (di) Time lapse single cell imaging of mitochondria after application of AF488-A53T α-Syn. (dii & iii) Δψm measured by TMRM fluorescent signal (intensity, a.u.) is significantly reduced after 2 hours whilst there is no change in the fluorescent signal (intensity, a.u.) of lysotracker after application of A53T α-Syn (n = 3 cells). Note. Data are represented as Data ± SEM (box) unless mentioned. *p < 0.05, ***p < 0.0005. Detailed statistical information is provided in Supplementary Table 1.

