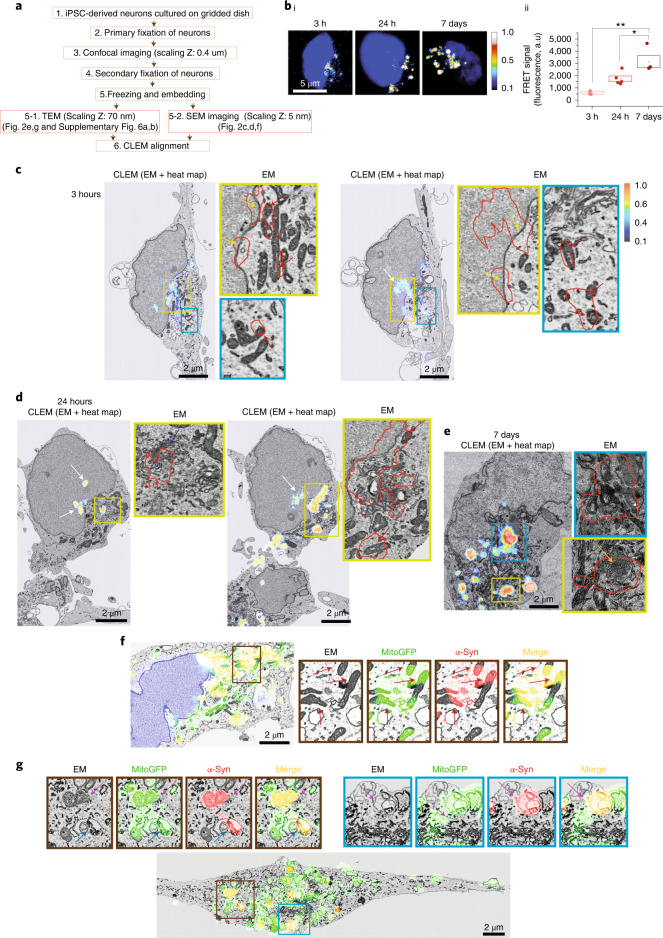
Fig. 2. Oligomer formation occurs in multiple cell ‘hotspots’ at heterogeneous locations.
a, Schematic workflow of the experimental steps for 3D-CLEM. The light imaging was performed at 0.4-μm intervals; the radial point spread function (PSF) (as given by , where λ is the excitation wavelength and NA is the numerical aperture of the objective lens) is 212 nm, and the axial PSF is approximately 500 nm. The EM section thickness is 5 nm, and the CLEM precision errors are shown in Extended Data Fig. 6. bi, FRET intensity heat maps showing aggregate formation with high FRET signal intensity at the core and low FRET intensity in the surrounding rim. bii, Intracellular FRET intensity increases after application of 500 nM A53T monomers (n = 3 independent experiments). c,d, Application of equimolar concentration of AF488-A53T α-Syn and AF-594-A53T α-Syn (total 500 nM); images were obtained at three different timepoints: 3 hours (c), 24 hours (d) and 7 days (e). Each panel is composed of a confocal image of CLEM (EM + FRET heat map) and zoom of EM alone. Colored arrows indicate aggregates at mitochondria (red), nucleus (white), membrane (yellow), Golgi apparatus (blue) and vesicles (orange). f,g, CLEM alignment using genetically engineered construct mitoGFP to label mitochondria (f: SEM and g: TEM). The red arrows indicate α-Syn detection within mitochondria. Note: Error maps for all images used for this figure are presented in Extended Data Fig. 5. Data are represented as data ± s.e.m. (box). *P < 0.05 and **P < 0.005. Detailed statistical information is shown in Supplementary Table 1. See also Extended Data Figs. 5 and 6. a.u., arbitrary units; PSF, point spread function.

