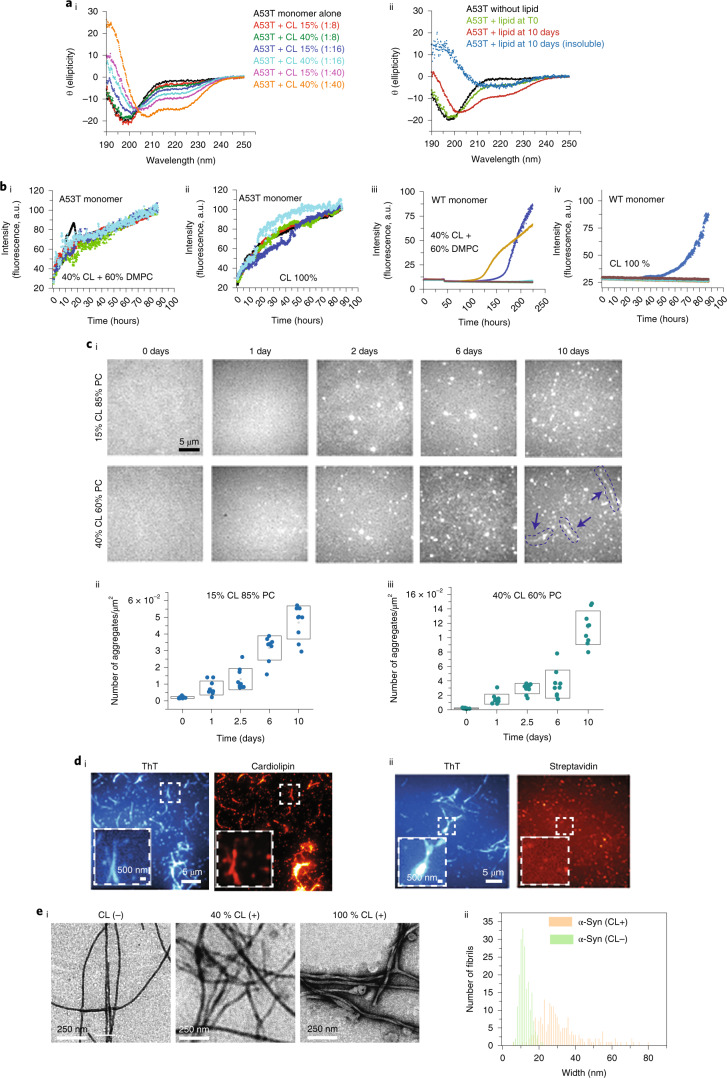
Fig. 3. CL triggers and accelerates the aggregation of A53T α-Syn.
a, Effect of CL on far-UV CD spectra of α-Syn. ai, A53T monomer (10 µM) in the presence of 15% and 40% CL at 1:8, 1:16 and 1:40 lipid:protein ratios. aii, A53T monomer in the absence of liposomes (black curve), in the presence of 40% CL before incubation (green curve), at plateau phase (red curve) and insoluble fraction (blue curve) after incubation at 37 °C in the presence of 40% CL and 60% PC liposomes with 1:8 ratio. The minima between 210 nm and 220 nm for the insoluble fraction shows the presence of amyloid structures in the sample. bi–biv, 50 µM of the A53T monomer led to a substantially fast increase in ThT fluorescence in the presence of 40% or 100% CL compared to WT monomer. c, Time-dependent SAVE images of A53T monomers incubated with 15% or 40% CL over 0–10 days show an increase in the number of aggregates over time. ci, Representative images. Red arrows indicate amyloid fibrils. cii,ciii, Quantification of the TIRF microscopy images. di,dii, TIRF microscopy analysis shows co-localization between CL and α-Syn fibrils (ThT positive). ei, TEM images show that, in the presence of CL, fibrils of α-Syn have different morphology. eii, Quantitative histogram of fibril width shows the large distribution of width in the presence of CL (100% CL), which is expected for a hierarchical self-assembly model of amyloid formation. A total of 200 fibrils were analyzed for each group using an Image-J plugin54. Note: Data are represented as mean ± s.d. Detailed statistical information is shown in Supplementary Table 1. See also Extended Data Fig. 7. a.u., arbitrary units; DMPC, dimyristoylphosphatidylcholine.

