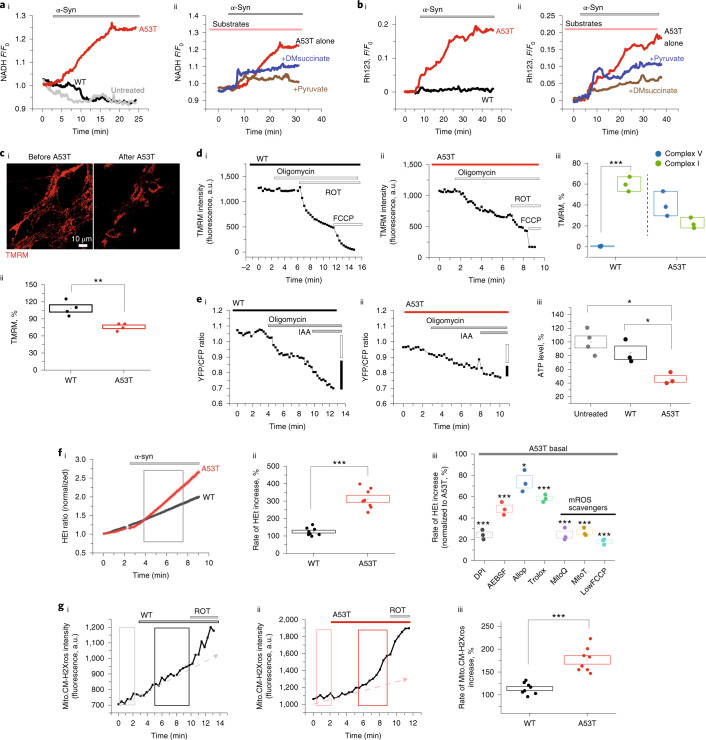
Fig. 5. A53T α-Syn impairs mitochondrial bioenergetics and induces mitochondrial dysfunction.
ai, Increase in NADH autofluorescence after application of 500 nM A53T α-Syn (normalized to 1). aii, The increase in NADH is prevented by pre-incubation with pyruvate and succinate. bi, A53T monomer depolarizes Δψm as measured by an increase in rhodamine 123 (Rh123) fluorescence. bii, The decreased Δψm is also reversed by pre-application of pyruvate and succinate. ci,cii, Images showing reduction in Δψm after 30-minute incubation with A53T compared to WT and the quantitative histogram (n = 4 independent experiments). di–diii, Response of Δψm to complex V inhibitor (oligomycin: 2.4 μg ml−1), complex I inhibitor (rotenone (ROT): 5 μM) and mitochondrial uncoupler (FCCP: 1 μM). The basal fluorescence intensity was reset at 1,500–2,500 a.u. (n = 3 independent experiments). ei–eiii, A53T reduces the total ATP production measured by FRET-ATP sensor compared to WT-treated or untreated cells (n = 3 or 4 independent experiments). fi,fii, Superoxide was increased after application of A53T but not WT α-Syn (n = 8 independent experiments). fiii, Inhibition of A53T-induced ROS by different inhibitors (n = 3 independent experiments). gi–giii, mROS production was increased by A53T (n = 8 independent experiments). Note: 500 nM α-Syn monomer was applied for each experiment unless otherwise mentioned. Note: Data are represented as data ± s.e.m. (box). *P < 0.05, **P < 0.005 and ***P < 0.0005. Detailed statistical information is shown in Supplementary Table 1. See also Extended Data Fig. 8. a.u., arbitrary units.

