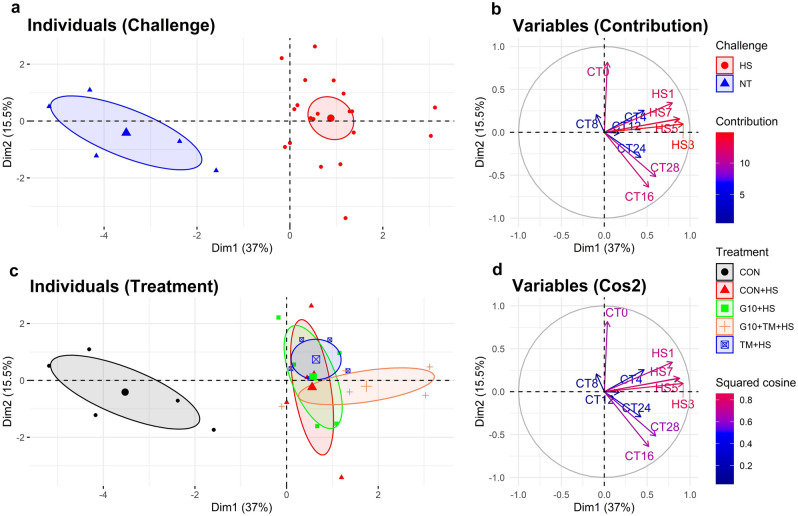
Figure 3.
Principal component analysis (PCA) plot of individuals and variables. An individual refers to a replicate per treatment while a variable is a rectal temperature (RT) record. The individuals have been colored according to the challenge (A) and treatments (C). The variables have been colored based on their contribution (B) or their squared cosine (D). Precisely, CTX refers to RT records at a day X of thermoneutral condition; similarly, HSX refers to RT records at a day X of HS challenge. The PCA was executed in R using the package “FactoMineR”. Multivariate analysis of variance (MANOVA) based on the first 3 dimensions of the PCA explaining 65.9% of variability revealed that treatment and challenge had a significant influence on data clustering. The challenges are described as follows: NT thermoneutral temperature, HS heat stress. The treatments are as follows: CON chicks hatched from control eggs without in ovo injection and incubated at standard temperature, CON + HS chicks hatched from control eggs without in ovo injection, incubated at standard temperature but exposed to HS, G10 + HS chicks hatched from eggs injected at embryonic day (ED) 17.5 with 0.6 mL of 10% GABA dissolved in distilled water and exposed to HS, TM + HS chicks hatched from thermally manipulated eggs exposed to 39.6 °C for 6 h daily from ED 10 to 18 and exposed to HS, G10 + TM + HS chicks hatched from eggs that received both previous treatments during incubation and exposed to HS. The dotted line indicates the level at which the K-means algorithm truncates the dendrogram (in this case, the line cuts to show how the three groups are separated).

