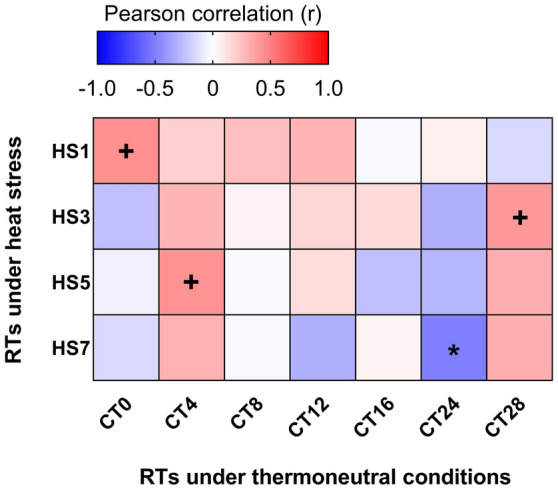
Figure 4.

Pearson correlation heat map between the RTs under thermoneutral conditions (CT), and RTs under heat stress (HS) in broiler chickens. Each row represents an RT record during heat stress and each column represents an RT record during thermoneutral temperature. Precisely, CTX refers to RT records at a day X of thermoneutral condition; similarly, HSX refers to RT records at a day X of HS challenge. The red color indicates a positive correlation, the blue color indicates a negative correlation and the white color indicates no correlation. Pearson r values were calculated using the “CORR procedure” of the SAS software version 9.4 (SAS Institute Inc., 2009). +Indicates a trend at P < 0.1 level. *Correlation is significant at P < 0.05 level.
