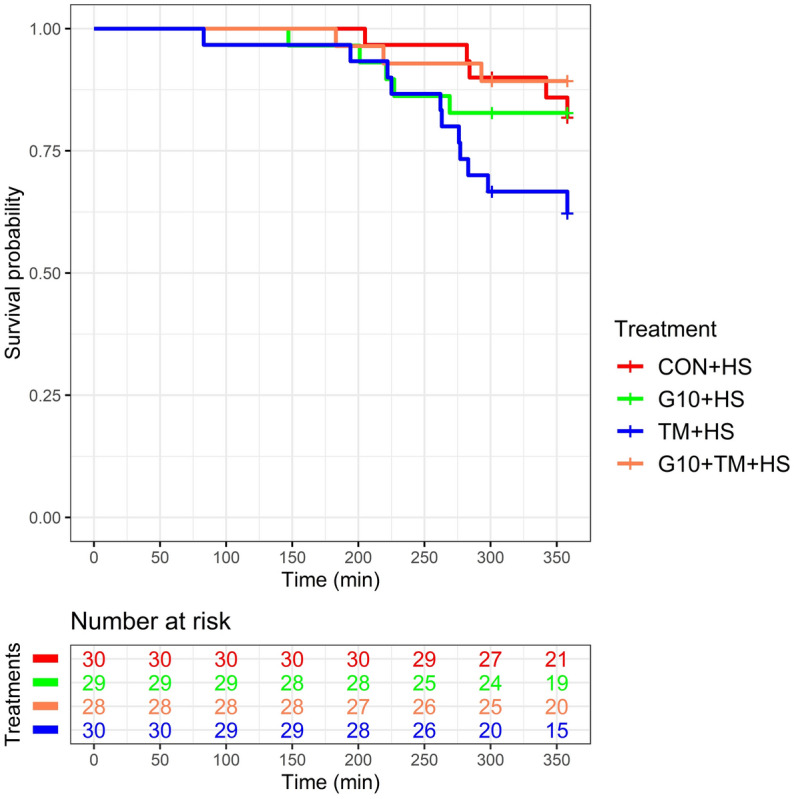
Figure 5.

Kaplan-Meir survival curves and risk table of broilers exposed to HS. At t = 301 min, 5 birds per treatment were censored for biological sampling. The x-axis (Time) represents the time elapsed during the HS challenge. The “Number at risk” refers to the number of birds alive at a specific time per treatment. The treatments are as follows: CON chicks hatched from control eggs without in ovo injection and incubated at standard temperature, CON + HS chicks hatched from control eggs without in ovo injection, incubated at standard temperature but exposed to HS, G10 + HS chicks hatched from eggs injected at embryonic day (ED) 17.5 with 0.6 mL of 10% GABA dissolved in distilled water and exposed to HS, TM + HS chicks hatched from thermally manipulated eggs exposed to 39.6 °C for 6 h daily from ED 10 to 18 and exposed to HS, G10 + TM + HS chicks hatched from eggs that received both previous treatments during incubation and exposed to HS.
