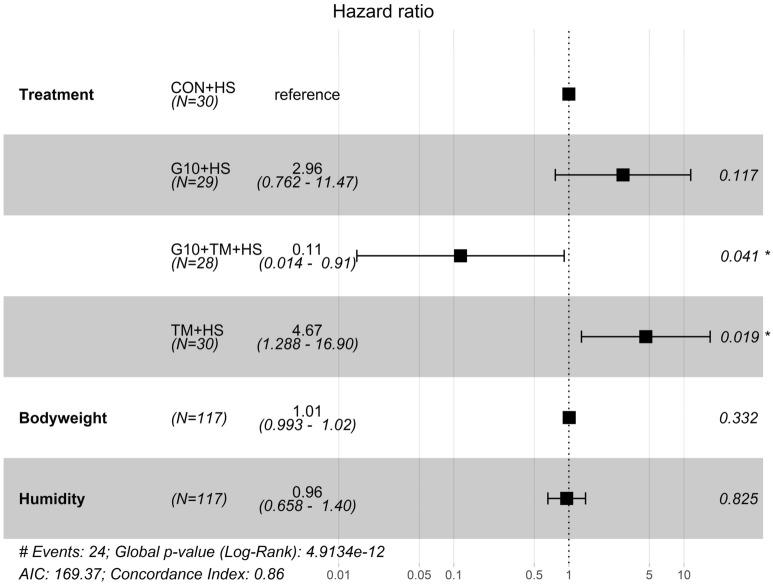
Figure 6.
Forest plot of the Cox proportional-hazards model of broilers chickens exposed to cyclic heat stress. The model was built with the package “Survminer” of the R software version 4.0.3 (R Core Team, 2020). Covariates retained in the model are presented on the left with bolded letters. The vertical dashed line refers to a hazard ratio of 1. The black squares and their intervals refer respectively to the hazard ratios and 95% confidence intervals associated with each covariate. A hazard ratio above 1 indicates a positive association with death; a hazard ratio below 1 indicates a reduction in the probability of death. The treatments are as follows: CON chicks hatched from control eggs without in ovo injection and incubated at standard temperature, CON + HS chicks hatched from control eggs without in ovo injection, incubated at standard temperature but exposed to HS, G10 + HS chicks hatched from eggs injected at embryonic day (ED) 17.5 with 0.6 mL of 10% GABA dissolved in distilled water and exposed to HS, TM + HS chicks hatched from thermally manipulated eggs exposed to 39.6 °C for 6 h daily from ED 10 to 18 and exposed to HS, G10 + TM + HS chicks hatched from eggs that received both previous treatments during incubation and exposed to HS.

