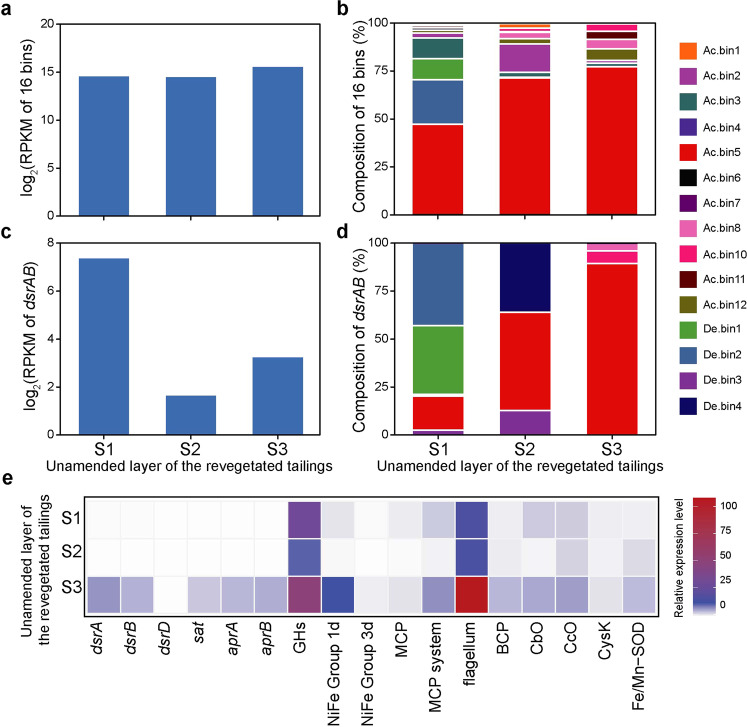
Fig. 5. Transcriptional profile of the 16 SRMs reported in this study.
a Overall transcript abundance of the 16 SRMs. b Relative contribution of individual SRMs to the overall transcript abundance of the 16 SRMs. c Overall transcript abundance of dsrAB of the 16 SRMs. d Relative contribution of individual SRMs to the overall transcript abundance of dsrAB of the 16 SRMs. e Relative expression levels of selected genes of Ac.bin5. Relative expression level was calculated based on the reads per kilobase per million mapped reads (RPKM) of a given selected gene normalized by that of the reference gene gyrA. The gene abbreviations are in accordance with those in Fig. 2. The results are based on three soil samples collected from the unamended layer of the revegetated tailings.

