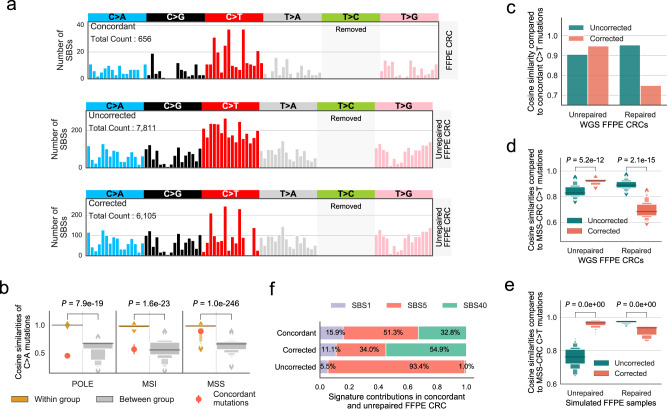
Fig. 4. Applying FFPEsig on two real CRC FFPE samples.
a Corrected mutational profile of unrepaired-FFPE CRC tumour is highly similar to concordant (true) somatic mutation pattern. CRC: colorectal cancer. We removed T>C mutations for clear visualisation of other channels (otherwise will be masked), and their full 96-channel profiles are shown in Supplementary Fig. 11d–f. b The tumour is an MSS CRC based on the concordant mutation profile. We calculated cosine similarities of unique sample pairs within and between three subgroups (POLE, MSI and MSS) on the most conserved C>A mutations (Supplementary Fig. 13b). There are n = 28 (POLE-POLE), n = 36 (MSI-MSI), and n = 903 (MSS-MSS) independent sample pairs within each subgroup, and n = 416 (POLE-MSS/MSI), n = 459 (MSI-POLE/MSS) and n = 731 (MSS-MSI/POLE) sample pairs between the subgroups. POLE: polymerase epsilon mutated, MSS: microsatellite stable, MSI: microsatellite instability. Data are presented using a Letter-Value plot and the black line corresponds to the median of the dataset, and every further step splits the remaining data into two halves (the same for d, e below). The P values were derived from the two-sided Mann–Whitney U test. c, d FFPEsig correction works well for unrepaired but not for repaired FFPE according to concordant mutations (c) and to PCAWG MSS-CRCs (d). We calculated the cosine similarity of corrected and uncorrected FFPE profiles to n = 43 independent MSS-CRC samples in d. The P values were derived from the two-sided Mann–Whitney U test. e The correction also works well for unrepaired but not for repaired synthetic MSS-CRC FFPE samples. We repeated our analysis in (d) on simulated FFPE samples. Therefore, we compared each simulated sample to all MSS-CRC profiles but their real biological profile to match with the scenario that the two real CRC tumours have no paired FF sample. In total, we obtained n = 1806 independent data points for repaired and unrepaired samples each. The P values were derived from the two-sided Mann–Whitney U test. f Similar activity fits observed between concordant and corrected (but not uncorrected) unrepaired-FFPE profiles. Source data are provided as in a Source Data file.

