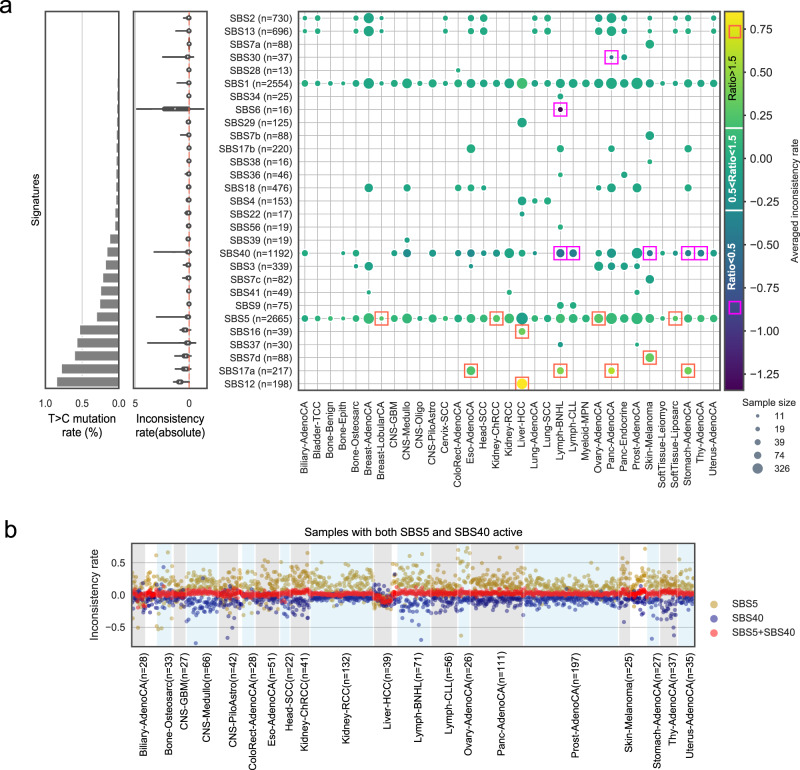
Fig. 5. Using adjusted 80-channel signature has minimal effect on activity inference.
a Similar activities inferred by 96-channel (96c) and 80-channel (80c) signatures in most PCAWG samples. We show the signatures that are active in at least 20 cancer samples. We use an inconsistency rate to measure the dissimilarity of the inferred activities, which is calculated using log10(activity_80c/activity_96c). The three panels in a share the same y-axis and the labels are shown in the right panel. Left panel: sum of mutational probabilities of T>C channels of the signatures. Middle panel: violin plot of absolute inconsistency rate for each signature. The white dot represents the median value. The thick grey bar in the centre represents the interquartile range and the thin grey line represents the rest of the distribution. Right panel: heatmap of mean inconsistency rate for all signatures in different cancer types. Orange rectangle marks signatures with the average activity ratio (activity_80c/activity_96c) above 1.5, which indicates that 80c activity is larger than 1.5 times of 96c activity. The purple rectangle marks the averaged activity ratio below 0.5, which indicates 80c activity is smaller than 50% of 96c activity. The radius of each circle represents the sample size (in log scale). b The challenge of assigning activities between two flat and similar signatures (SBS5 and SBS40). The light-blue and light-grey shading areas are used for annotating main cancer types (n > 20 sample per type). The cancer types with n < 20 samples are shown in unshaded areas.

