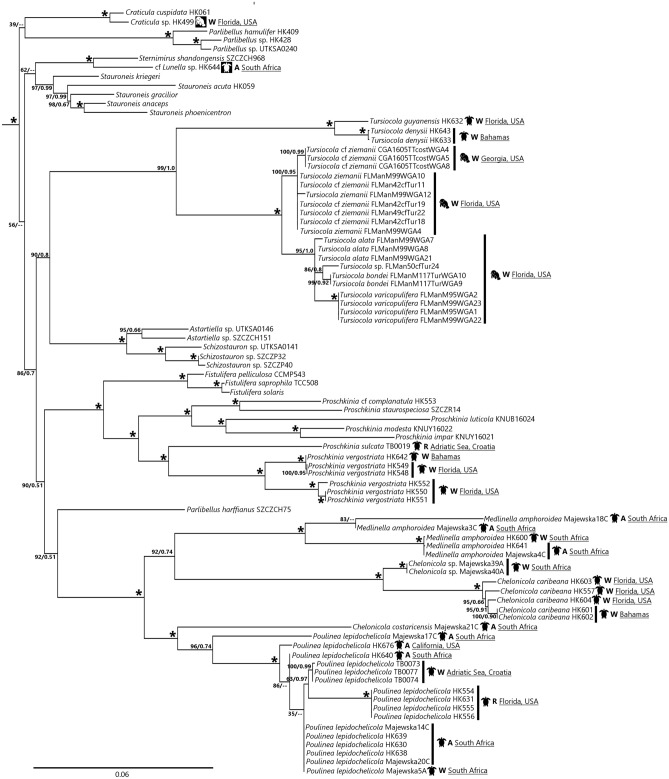
Figure 2.
Maximum likelihood phylogenetic tree derived from a concatenated 3-gene DNA sequence dataset, representing the clade containing the Tripterion complex, Tursiocola and Proschkinia clades (complete tree shown in Fig. S1). Support values (ML bootstrap support/BI posterior probability) shown above nodes; “*” = nodes with 100%/1.0 values. Taxon name followed by DNA extraction voucher number or strain ID. Taxa isolated from epizoic habitats followed by a diagrammatic representation of the host from which the strain was isolated, and metadata on the location and setting in which the host was sampled (A = aquarium, R = rehabilitation facility, W = wild). Black host icon = POE taxon; white host icon = unclear habitat preference.

