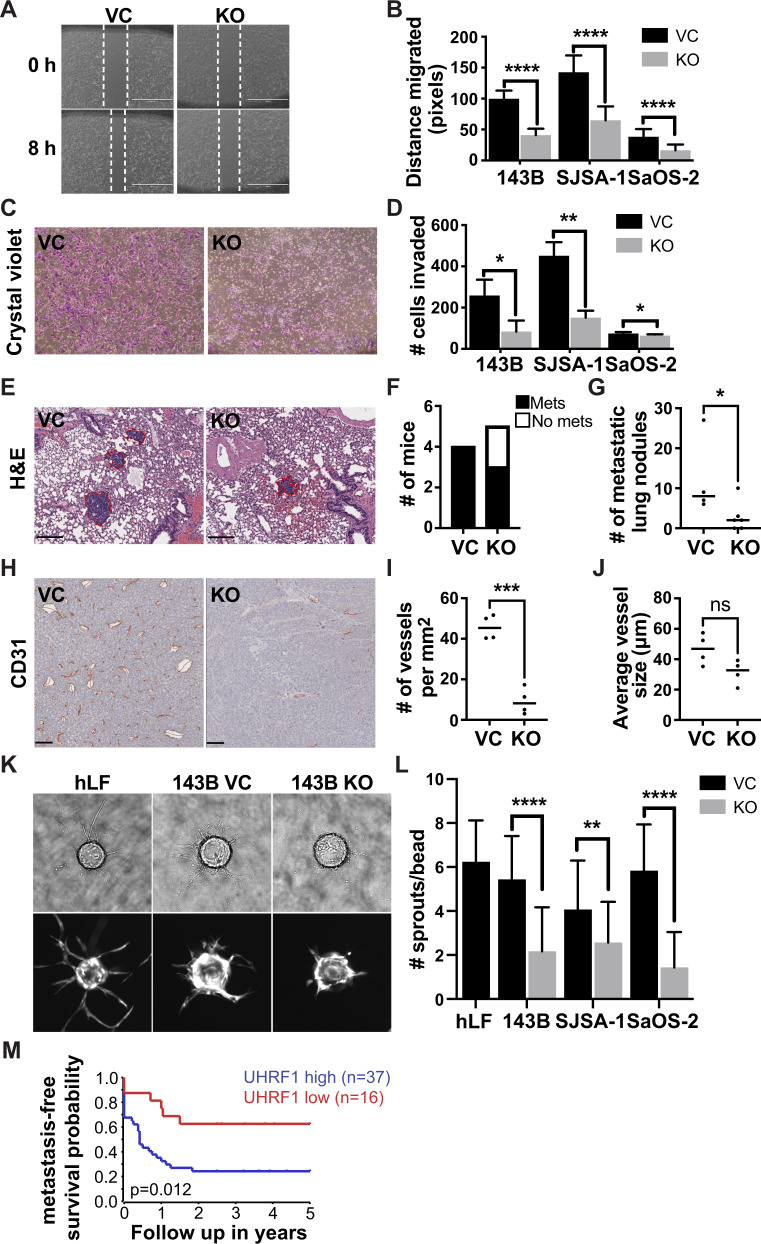
Fig. 3. UHRF1 promotes osteosarcoma cell migration and invasion in vitro and in vivo.
A Representative image from scratch-wound assay comparing wound closure of non-targeting vector control (VC) and UHRF1 KO (KO) cells over 8 h in SJSA-1 cells. White dashed lines represent the wound edge. Scale bar, 1000 μm. B Quantification of distance (pixels) migrated in scratch-wound assays for each of the osteosarcoma cell lines. Each data point is mean ± s.d. of ten measurements in triplicate samples. C Representative images from Transwell assays with cells stained with crystal violet (purple) comparing levels of invasion between VC and UHRF1 KO in SJSA-1 cells. D Quantification of the number of cells invaded across the Transwell membrane for each of the osteosarcoma cell lines. Each data point is mean ± s.d. of triplicate samples. E Representative histological images of H&E-stained lung section from intrafemoral-injected mice with VC and UHRF1 KO SJSA-1 cells, 5 weeks after injection. Scale bar, 200 μm. Quantification of the burden of lung metastases was quantified as (F) the number of mice with or without lung metastases and (G) the number of metastatic lung nodules per mouse. A solid line represents median from n = 4 for VC and n = 5 for KO. *P = 0.03 by unpaired t test. H Representative histological images of CD31 expression in intrafemoral tumors derived from VC and UHRF1 KO SJSA-1 cells, 5 weeks after injection and (I) quantification of the average number of vessels per mm2 and (J) quantification of the mean vessel diameter. Solid line represents median from n = 4. ns not significant; ***P = 0.002 by unpaired t test. Scale bars, 100 μm. K Representative brightfield (top) and fluorescent (bottom) images of late phase sprouting angiogenesis assay (day 6) using human lung fibroblasts as assay control and 143B VC and KO conditioned media in the fibrin gel bead assay. This is quantified as (L) the number of sprouts per bead. n = 30. M 5-year metastasis-free survival probability of osteosarcoma patients comparing tumors with high UHRF1 (blue, n = 37) versus low UHRF1 (red, n = 16) expression at the time of diagnosis. For all graphs: *P < 0.05, **P < 0.01, ****P < 0.0001 by unpaired two-tailed t test.

