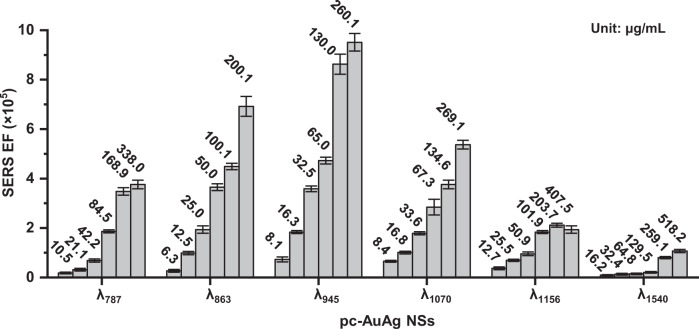
Fig. 4. SERS performance evaluation.
SERS enhancement factors of pc-AuAg NSs with various plasmon resonance wavelengths were measured at varied concentrations (unit: μg/mL). The concentration for each measurement of SERS enhancement factor is shown on top of each column for each type of pc-AuAg NSs, and IR-1061 dye was used as the Raman molecule at a fixed concentration of 1.0 μM in all these measurements. Data are presented as mean values ± SD (n = 37 independent experiments).

