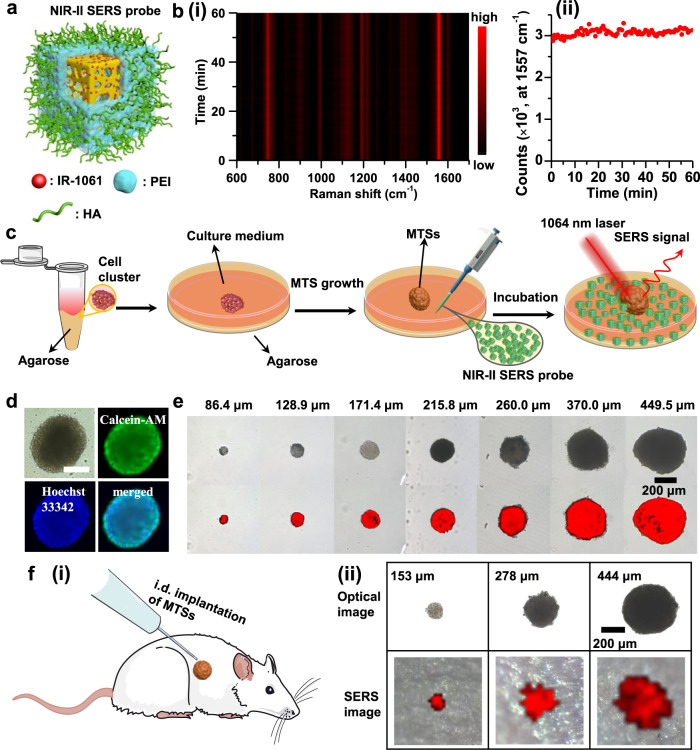
Fig. 5. NIR-II SERS imaging of MTSs.
a A schematic of a NIR-II SERS probe comprising a pc-AuAg NS core, IR-1061 dye as the Raman reporter, a PEI coating layer, and HA capping ligand. b (i) Time-dependent SERS spectra and (ii) the intensity change of the 1557 cm−1 SERS peak of the present NIR-II SERS probes over a 60 min continuous exposure to a 1064 nm-laser at a power of 80.1 mW (integration time: 1 s, objective lens: ×50). c Schematic illustration of the preparation process of MTSs and their in vitro NIR-II SERS measurements. d Optical photographs and fluorescence images of a representative MTS co-stained with Calcein-AM (green) and Hoechst 33342 (blue), confirming the live cells in the MTS. Scale bar: 200 μm. e Optical photographs and the corresponding NIR-II SERS images of MTSs of various sizes, created with the DCLS algorithm. f (i) Schematic illustration of the i.d. implantation of MTSs into a living mouse and (ii) the corresponding in vivo NIR-II SERS imaging of implanted MTSs of three different sizes (153, 278, and 444 μm in diameter). The 4T1 MTSs were first incubated with NIR-II SERS probes for 12 h and then washed with fresh cell culture medium, followed by implantation into a living mouse for SERS measurements (×5 objective lens, 7.4 mW laser power, 1 s integration time, 50 μm step size).

