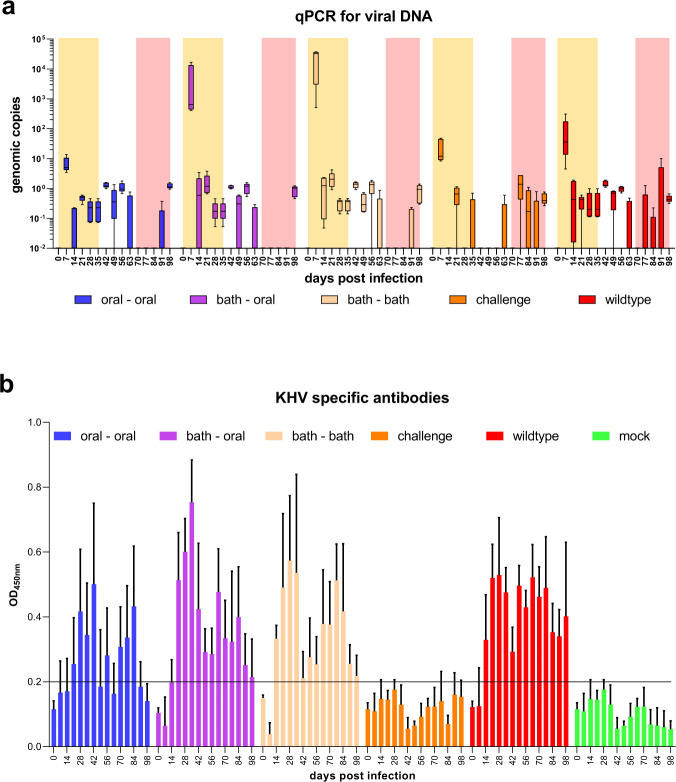
Fig. 4. Genetic and serological data of different vaccine applications.
Viral load in gill swabs was recorded over the whole time of the trial by qPCR detection of viral DNA a. The first five weeks (prime) are marked by a yellow background, while a white background is used for the next five weeks (boost), and the red background for the last five weeks after challenge. Boxplot: center line—median, limits—25th and 75th percentiles, whiskers—minimum and maximum. Humoral immune response was determined by ELISA b. The assay on plates coated with virus particles detects KHV-specific antibodies, which are present after vaccination/infection. Error bars represent standard deviation.

