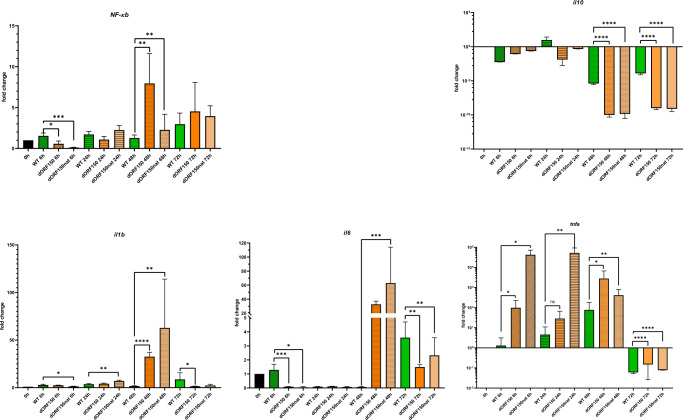
Fig. 6. Expression profile of certain host genes.
mRNA expression profile of affected genes in CCB cells after KHV infection. Green bars represent wildtype KHV infection, orange bars represent ΔORF150 KHV infection and pale orange bars represent ΔORF150nat KHV infection. All samples were prepared as triplicates. Expression profile was measured by q-RT-PCR using SYBR Green. Data are normalized to actb and rps11 expression levels. Error bars represent standard deviation. ns: not significant, *p ≤ 0.05, **p ≤ 0.01, ***p ≤ 0.001, ****p ≤ 0.0001, significance test: students t-test.

