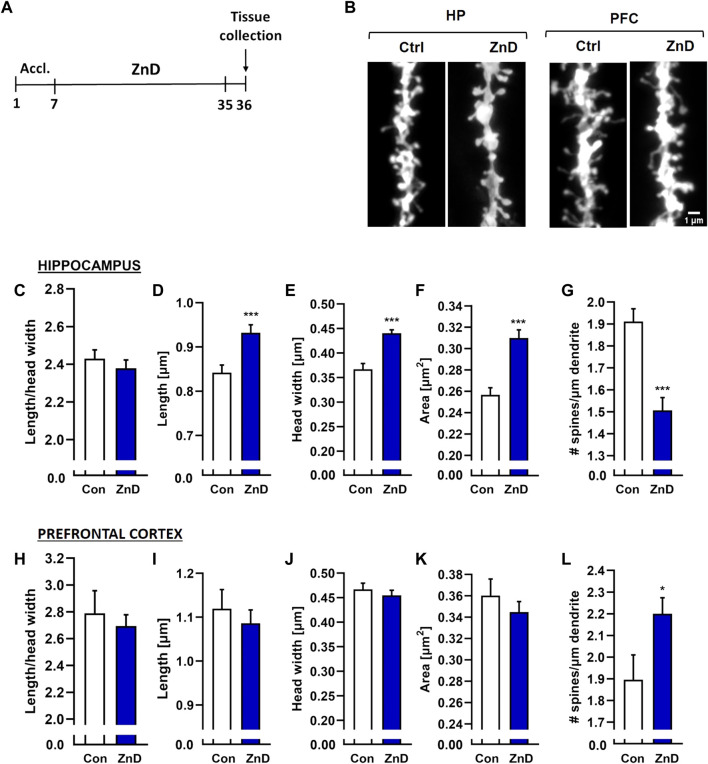
FIGURE 4.
(A) Experimental schedule. (B) Representative confocal images of DiI-stained dendrite fragments from the hippocampus (Hp) and prefrontal cortex (PFC) of naïve (Con) and zinc-deficient mice. Changes in the shapes and densities of spines in the (C) Hp and (D) PFC in control and ZnD mice. All values are expressed as mean ± SEM. The data were analyzed by Mann–Whitney test [Hp, (C–G)], Student’s t-test with Welch’s correction [PFC, (H)], and Student’s t-test [FC, (I–L)]. [ZnA: morphology: n mice = 4, n dendrites = 66, n spines = 7845; density: n mice = 4, dendrites = 65, total dendrite length = 6334 μm; ZnD: morphology: n mice = 4, n dendrites = 55, n spines = 4489; density: n mice = 4, n dendrites = 57, total dendrite length = 4202 μm]; FC [ZnA: morphology: n mice = 4, n dendrites = 15, n spines = 1204; total dendrite length = 864 μm; ZnD: morphology: n mice = 4, n dendrites = 19, n spines = 1817; density: n mice = 4, dendrites = 20, total dendrite length = 914 μm]. *p < 0.05, ***p < 0.001 vs Con. Con: control, ZnD: zinc defcient diet.

