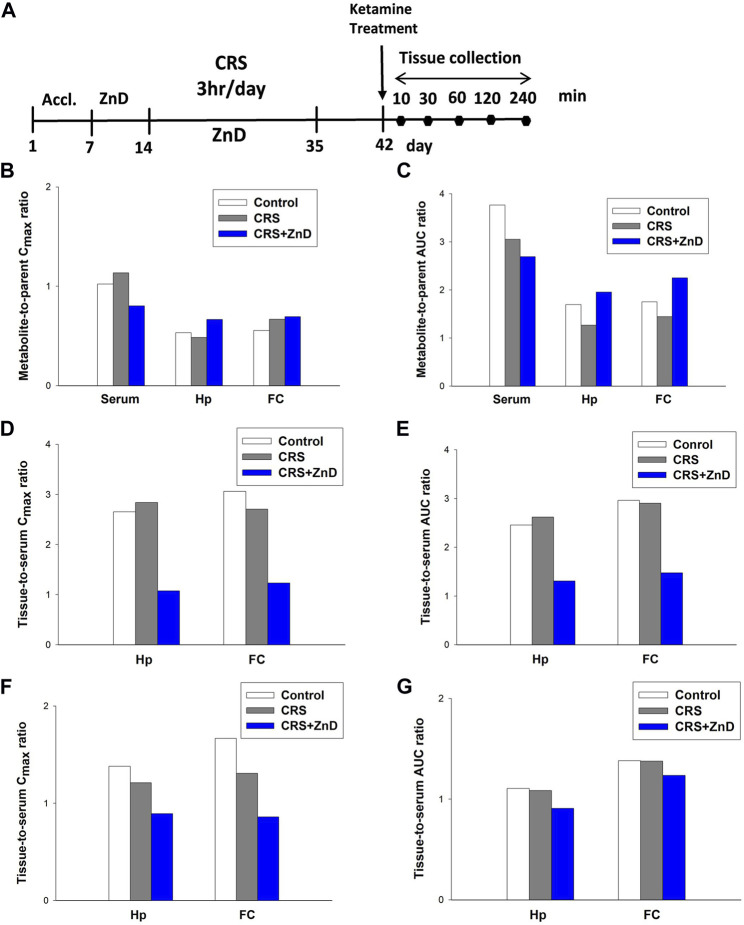
FIGURE 8.
(A) Experimental schedule of drug treatment. (B,C) Metabolite-to-parent ratios of maximum concentrations (Cmax; left panel) and areas under the curves (AUCs; right panel) in the control and study groups. (D,E) Tissue-to-serum ratios of Cmax (left panel) and AUCs (right panel) for ketamine in the control and study groups. (F,G) Tissue-to-serum Cmax (left panel) and AUCs (right panel) for (2R,6R;2S,6S)-HNK in the control and study groups. CRS: chronic restraint stress, FC: frontal cortex, Hp: hippocampus, ZnD: zinc deficient diet.

