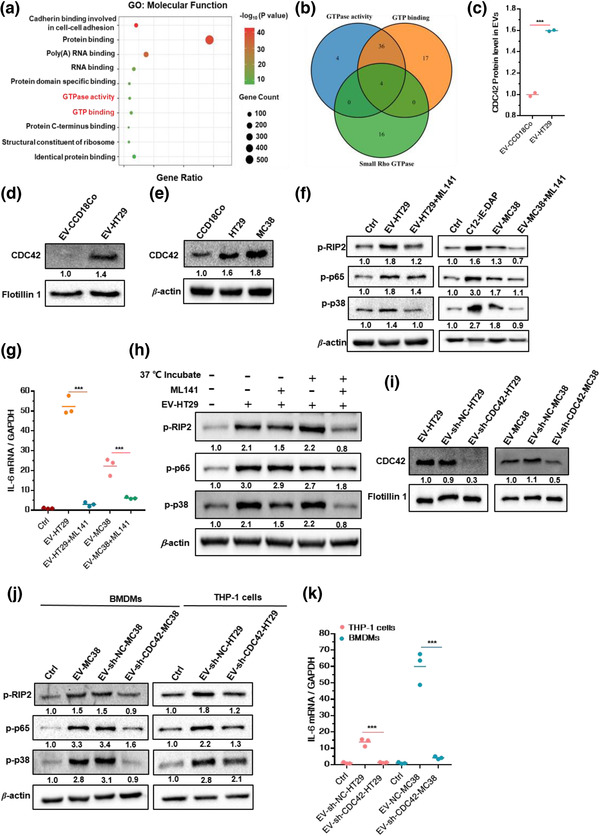
FIGURE 3.

CDC42 in CRC‐EVs mediate NOD1 activation in macrophages. (a) Gene ontology (GO) analysis of proteins upregulated in EV‐HT29 compared to that in EV‐CCD18Co; only significantly enriched molecular functions are shown (p‐value < 0.05). (b) Overlap between known small Rho GTPases, proteins with molecular function of GTP binding, and GTPase activity. (c) Comparison of CDC42 protein levels in EV‐HT29 and EV‐CCD18Co; (n = 3). (d ane) Relative levels of CDC42 in (d) EVs (versus Flotillin 1) or cells (versus β‐actin); (n = 3). (f) Relative levels of p‐RIP2, p‐p65 and p‐p38 in THP‐1 cells following 30 min treatment with EV‐HT29 or EV‐MC38 pre‐incubated with ML141(20 μM); (n = 3). (g) Relative IL‐6 expression in THP‐1 cells following 90 min treatment with EV‐HT29 or EV‐MC38 pre‐incubated with ML141 (20 μM); (n = 3). (h) Relative levels of p‐RIP2, p‐p6 and p‐p38 in THP‐1 cells treated for 30 min with EV‐HT29 (with or without pre‐incubation with ML141); (n = 3). (i) Relative level of CDC42 versus Flotillin 1 in EVs from CDC42‐knockdown CRC cells or NC cells; (n = 3). (j and k) THP‐1 cells or BMDMs were stimulated with EVs from CRC cells with CDC42 knockdown or the NC cells. (j) Relative levels of p‐RIP2, p‐p65 and p‐p38 in THP‐1 cells or BMDMs stimulated with EVs from CDC42‐knockdown CRC or NC cells; (n = 3). (k) Relative IL‐6 expression in THP‐1 cells or BMDMs stimulated with EVs from CDC42‐knockdown CRC or NC cells; (n = 3). Data are presented as mean ± S.D. (error bars) of three independent experiments. *p < 0.05; **p < 0.01; ***p < 0.001. Student's t‐test was used to determine the significance level
