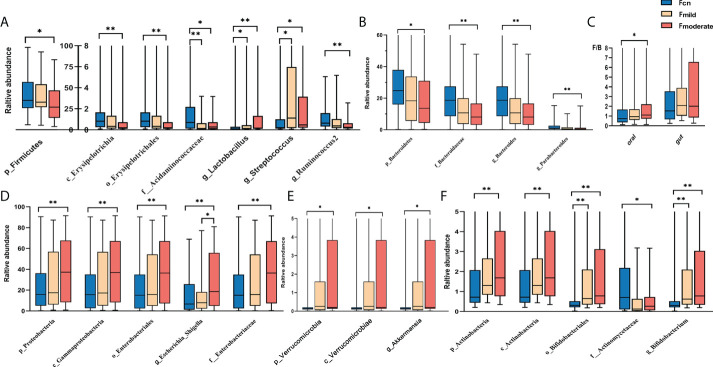
Figure 4.
Alteration of gut predominant microbiotas among the three groups (A–F). Comparison among the three groups by Kruskal–Wallis-test analysis, and significant taxa classifications obtained by Post Hoc test using Bonferroni adjustment. *p <0.05, ** p<0.01; Fcn, feces of normal cognition controls; Fmild, feces of mild AD; Fmoderate, feces of moderate AD; IQR, interquartile range.

