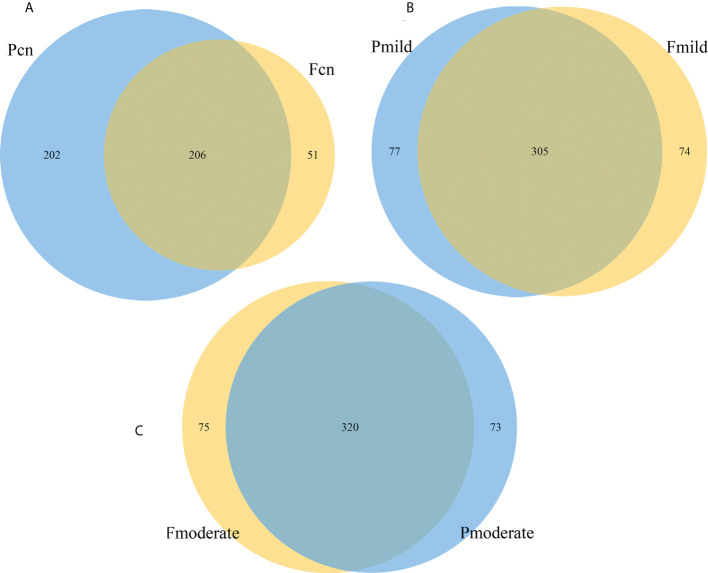
Figure 7.
The similarity and overlap with oral and fecal microbiotas. The Venn diagrams illustrate all overlapping genera identified in the oral and gut microbiota in the normal control (A), the mild AD (B), and the moderate AD (C) groups. Subgingival and gut microbiomes are colored in blue and yellow nodes, respectively. Pcn, subgingival plaque of normal cognition controls; Fcn, feces of normal cognition controls; Pmild, subgingival plaque of mild AD; Fmild, feces of mild AD; Pmoderate, subgingival plaque of moderate AD; Fmoderate, feces of moderate AD.

