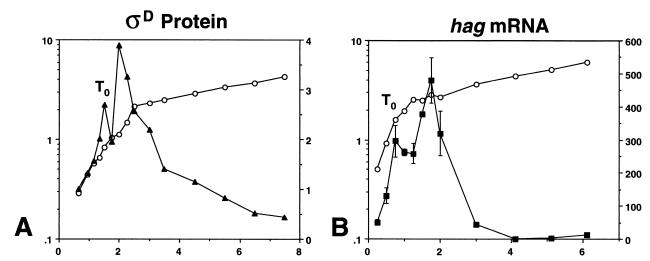
FIG. 1.
ςD protein and hag mRNA levels during growth of wild-type strain LMB7 in a complex medium. For each panel, the left y axis is the absorbance at 600 nm, the right y axis is the expression level in arbitrary units, and the x axis is time expressed in hours. Symbols: open circles, growth; closed triangles, ςD protein; closed squares, hag mRNA. (A) Typical results of quantitative immunoblot analysis of ςD protein during growth. Standard error levels ranged from 5 to 9% of the value indicated. (B) Results of a primer extension analysis using a primer specific to hag mRNA. Data presented are the means of values from two experiments. The break from exponential growth is indicated in each panel as T0.

