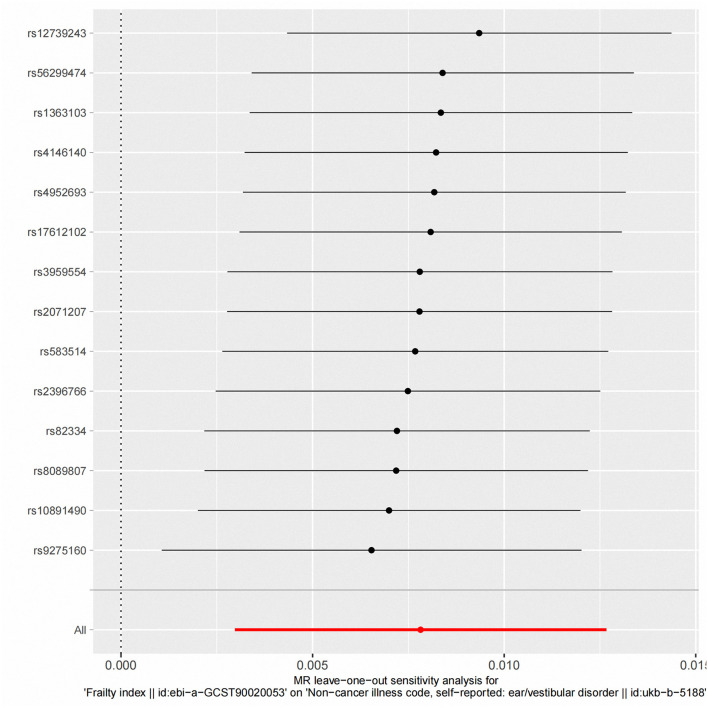
Figure 4.
“Leave-one-out” analysis of the causal association of frailty Index and vestibular disorders. The black dots and bars indicate the causal estimate and 95% CI when an SNP was removed in turn. The red dot and bar indicate the overall estimate and 95% CI using the fixed-effect IVW method; CI, confidence interval; SNP, single nucleotide polymorphism; IVW, inverse-variance weighted.

