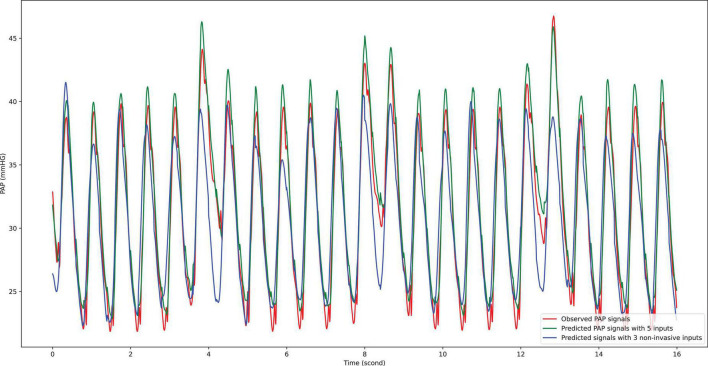
FIGURE 5.
Prediction result compared with observational data. To inspect the prediction result visually, a randomly selected segment of observational PAP signal was compared with prediction ones given by AI model with five input signals and three ones, respectively. The red line presents the observational PAP signal collected by the catheter procedure; the green line indicates the prediction results using five input signals; the blue line shows the prediction results using three input signals. On average, the estimation by five input signals is higher than that by three input signals.

