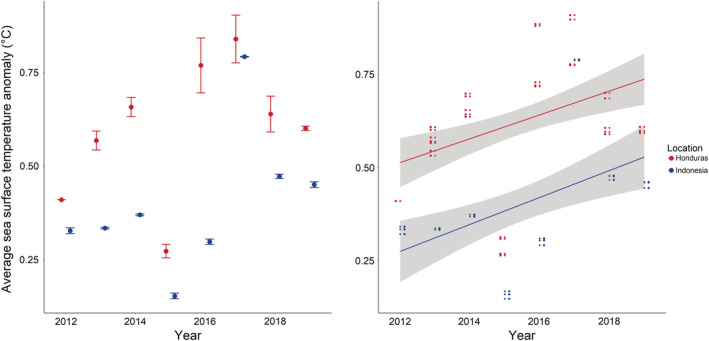
FIGURE 2.

Average sea surface temperature anomaly (SSTA) in °C and standard errors (whiskers) from 2012 to 2019 at the Indonesia and Honduras sites surveyed in this study. Temperatures were quantified from the 52 weeks preceding the survey period, which began at the June 1 for each site, each year. Points represent the mean SSTA, while error bars are standard error.
