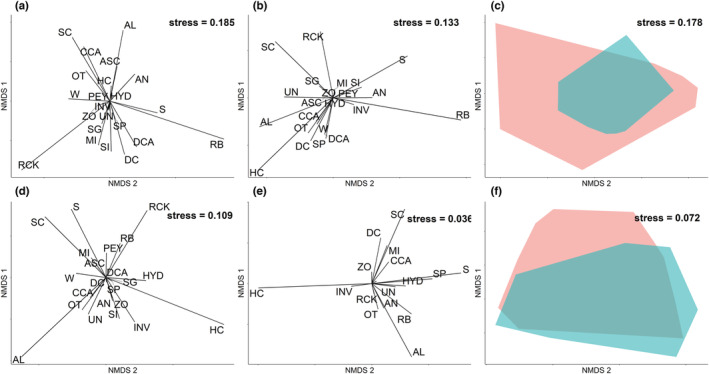
FIGURE 6.

nMDS analysis of the benthic community composition at the Indonesia sites (a–c) and Honduras sites (d–f). (a) and (d) are the composition of individual benthic components from 2012 to 2015. (b) and (e) are response of individual benthic components from 2016 to 2019 (i.e., showing the response of the global marine heatwaves that took place in 2016/2017 [Figure 2]). Letters represent the individual taxa, which are specified in Table 1. (c) and (f) represent the entire ordination space of the benthic composition at each individual reef, where the red polygon bounds the sites from 2012 to 2015, while the blue polygon bound sites from 2016 to 2019.
