
Fig. 3.
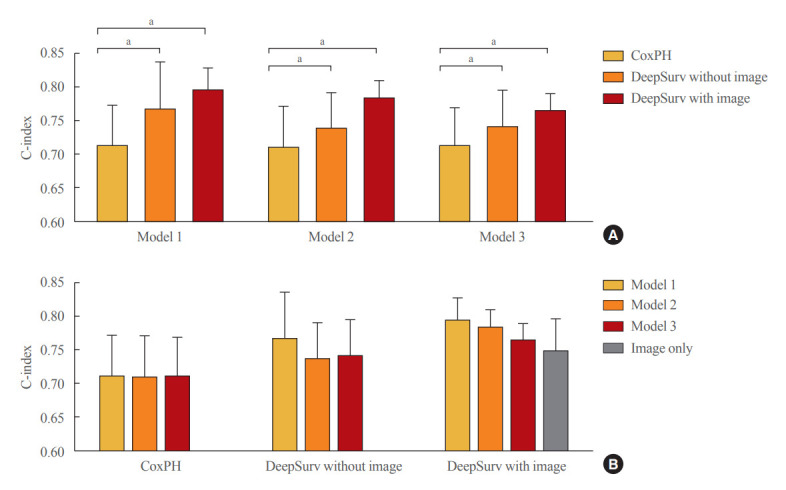
Performance of the fracture prediction model in the training set using Cox proportional hazard and DeepSurv methods (A) according to clinical models and (B) analytic methods. Model 1 adjusted for age and sex, model 2 additionally adjusted for body mass index, and model 3 additionally adjusted for the use of glucocorticoids and secondary osteoporosis. The C-index values were as follows: Model 1 (Cox proportional hazard [CoxPH], 0.712; 95% confidence interval [CI], 0.652 to 0.773; DeepSurv without images, 0.765; 95% CI, 0.693 to 0.837; DeepSurv with images, 0.794; 95% CI, 0.760 to 0.828); Model 2 (CoxPH, 0.709; 95% CI, 0.648 to 0.771; DeepSurv without images, 0.737; 95% CI, 0.683 to 0.791; DeepSurv with images, 0.782; 95% CI, 0.755 to 0.810); Model 3 (CoxPH, 0.712; 95% CI, 0.654 to 0.770; DeepSurv without images, 0.740; 95% CI, 0.686 to 0.795; DeepSurv with images, 0.764; 95% CI, 0.739 to 0.789). aP<0.05 between groups.