Figure 2.

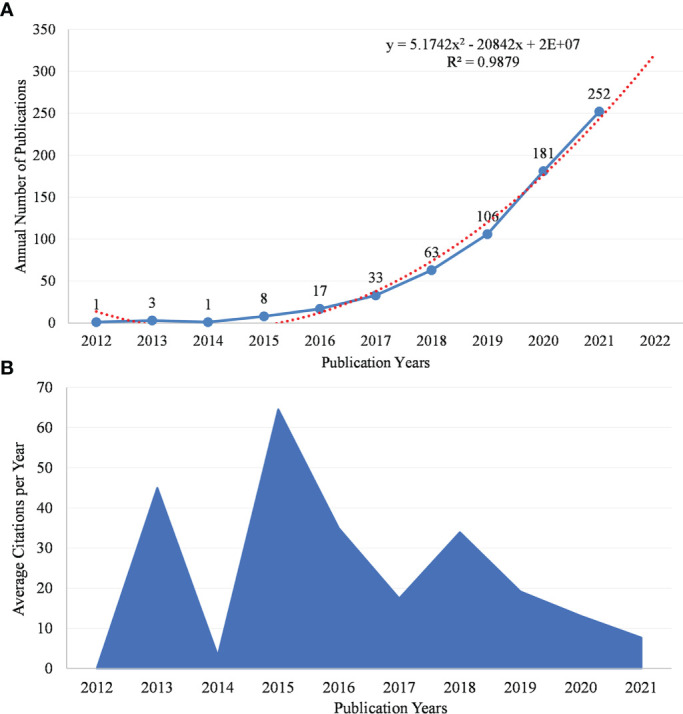
(A) Annual scientific production and the polynomial curve fitting of publications growth in GM/CI. (B) The number of average citations per year in GM/CI.

(A) Annual scientific production and the polynomial curve fitting of publications growth in GM/CI. (B) The number of average citations per year in GM/CI.