Figure 4.
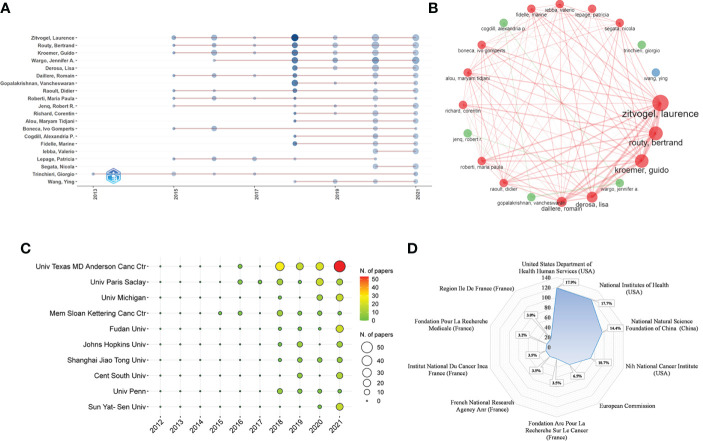
(A) The top 20 authors’ annual publication over time in GM/CI (the size of the circle represents the number of publications, and the larger the circle, the more the number of publications; the depth of the circle represents the average annual citation, and the darker the color, the more citations). (B) The top 20 authors’ co-authorship network in GM/CI (each node represents an author, the size of the node represents the number of published articles, the line represents the collaboration network between authors, and the thickness of the line represents the strength of collaboration). (C) The top 10 institutions’ annual publications over time in GM/CI. (D) The top 10 related funding agencies for the support of GM/CI research.

