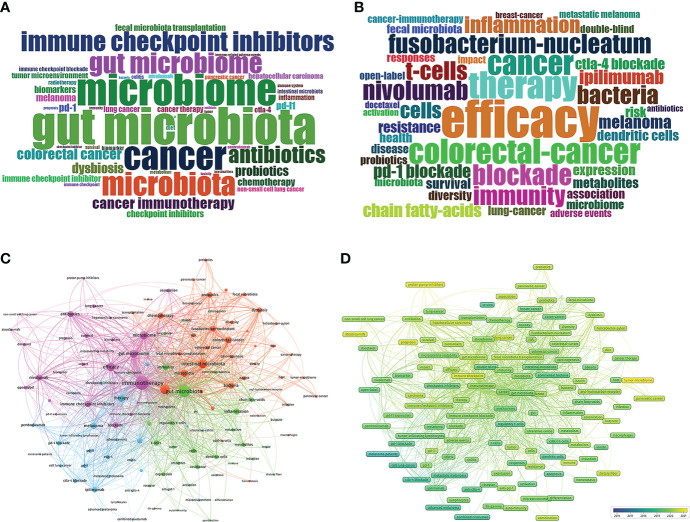
Figure 7.
(A) Distribution of top 50 Author Keywords in GM/CI. (B) Distribution of top 50 Keywords Plus in GM/CI. (C) Cluster analysis of high-frequency keywords (frequency ≥10) based on all keywords of publications in GM/CI (different colors represent different clusters, the size of the circle represents the frequency the keywords appear, and the thickness of the line represents the total link strength between keywords). (D) Trends in keywords (frequency ≥ 10) over time based on all keywords of publications in GM/CI (the blue boxes represent the earliest keywords and the yellow boxes represent the latest keywords).

