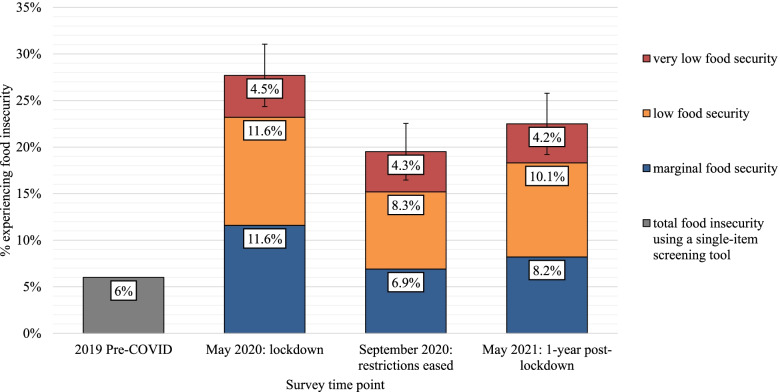
Fig. 1.
Age adjusted rates for food security categories: marginal, low, very low food security (error bars are 95% CI for total number of people who are “food insecure”) during lockdown, after restrictions eased and 1-year post lockdown. The 2019 pre-COVID prevalence statistic is estimated in a generalisable sample of the Tasmanian population using a single item food insecurity screening tool, which includes marginal, low and very low food security but is unable to define the severity of food insecurity experienced [12]. In May 2020, September 2020 and May 2021, food insecurity was determined using the USDA HFSSM 6-item tool [21, 22]

