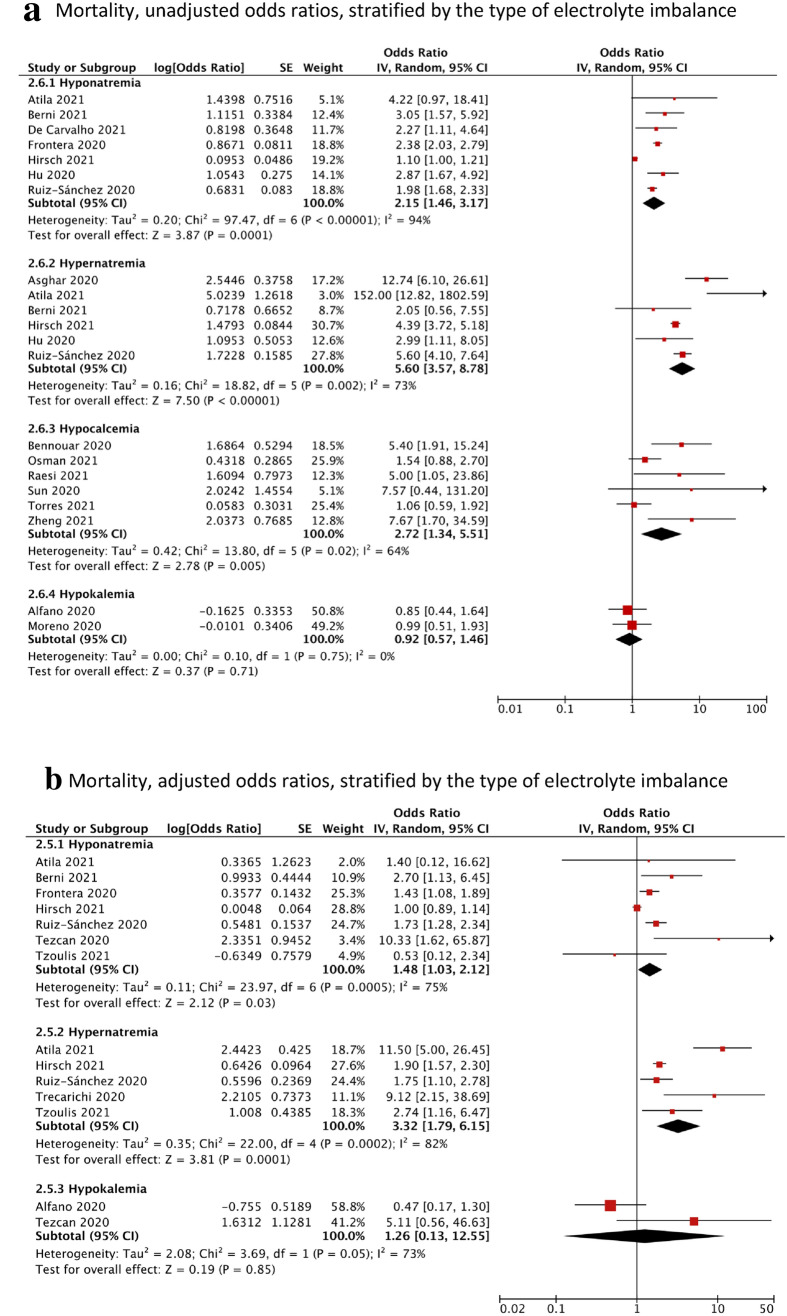
Fig. 3.
Forest plot showing the pooled unadjusted odds ratios (a) and adjusted odds ratios (b) of the association between electrolyte imbalances and mortality, stratified by the type of electrolyte imbalance. Black diamonds are the estimated pooled odds ratios for each random-effects meta-analysis; blue/red boxes reflect the relative weight apportioned to studies in the meta-analysis

