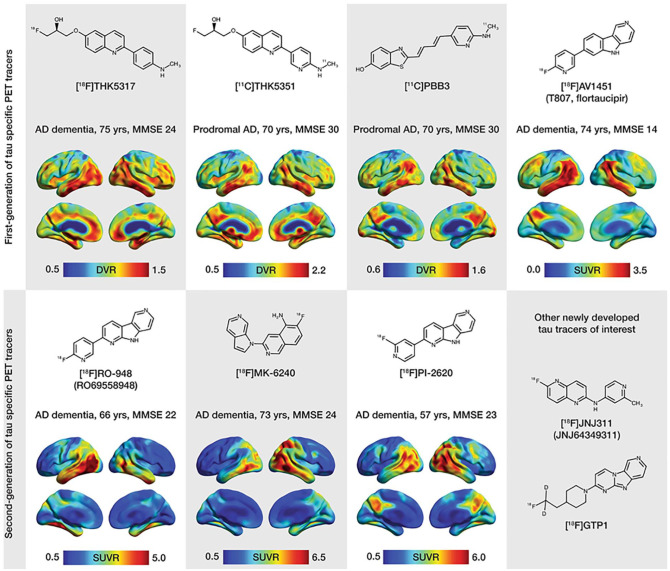
Figure 6.
Chemical structures and representative uptake images in amyloid-β-positive Alzheimer’s disease (AD) patients using selected first-generation (upper portion of the figure) and second-generation (lower portion of the figure) tau positron emission tomography (PET) tracers. The characteristics in terms of clinical research diagnosis, age, and Mini-Mental State Examination (MMSE) scores are presented for each patient above the respective image. For the creation of parametric images for all tracers, areas of the cerebellar cortex were used as reference. Reproduced with permission (Leuzy and others 2019a).

