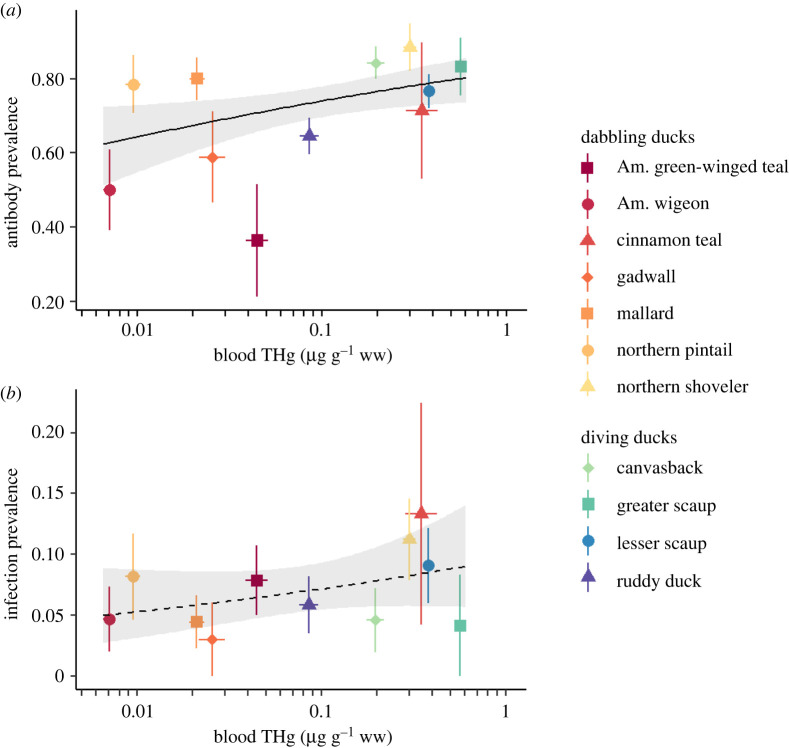
Figure 2.
Species-level relationships between influenza prevalence and average blood mercury concentration. Points and error bars show geometric mean and standard error for each variable in raw data. Black lines show the fitted relationship from univariate GLMs; shaded areas show 95% CIs. Note the log scale of the x-axis. (a) Antibody prevalence increases with blood mercury concentrations (β = 0.198, p = 0.013). (b) There is little evidence that infection prevalence increases with blood mercury concentrations (β = 0.140, p = 0.190). (Online version in colour.)

