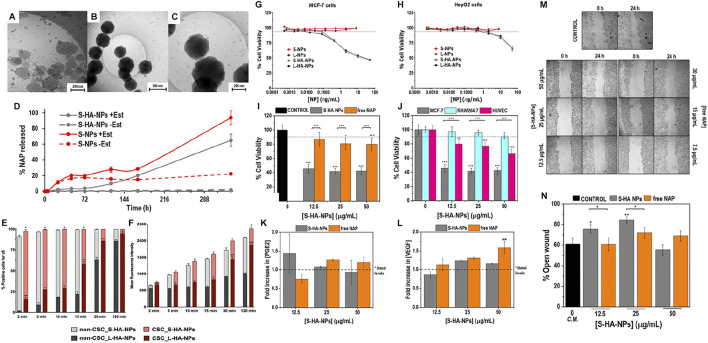
FIGURE 2.
(A) Uncoated NPs, without HA covering (B) HA-NPs at low magnification, (C) HA-NPs at higher magnification. (D) Naproxen release kinetics from HA-coated or uncoated NPs. (E) Percentage of positive cells for c6 and (F) the mean fluorescence intensity per cell (t-student, *p < 0.05, **p < 0.01, ***p < 0.001). In vitro cytotoxicity of HA-NPs in cells with differential expression of CD44. (G) Percentage of cell viability of MCF-7 cells (high expression of CD44) after 72 h of treatment with different concentrations. (H) Cell viability experiments in HepG2 cells (low expression of CD44) using the same NPs. Cell viability assays by Alamar Blue in MCF-7, RAW264.7 and HUVEC cells treated with S-HA-NPs. (I) Percentage of viable MCF-7 cells relative to control (culture media of MCF-7 cells) after 72 h of treatment with different concentrations. (J) Percentage of cell viability in respect to controls (cells treated with culture media) after 72 h of treatment with different concentrations of S-HA-NPs(Statistical analysis was performed by one-way ANOVA test with *p < 0.01, **p < 0.05 and ***p < 0.001). ELISA quantification of (K) PGE2 and (L)* VEGF released by MCF-7 cells after 72 h of treatment (Statistical analysis was performed by one-way ANOVA test with **p < 0.05). Wound healing assay in S-HA-NPs or free NAP treated MCF-7 cells. Effect of different concentrations of S-HA-NPs or free NAP on MCF-7 migration in vitro: (M) Inverted microscope images (20-fold magnification) of the wound at the beginning of the assay (0 h) and 24 h post-scratching and (N) Percentage of open wound after 24 h of treatment when compared to the original wound size (Statistical analysis was performed by one-way ANOVA with *p < 0.01 and **p < 0.05). Reproduced with permission from ref (Liu et al., 2018a). CC BY 4.0. Copyright 2021 The Authors.

