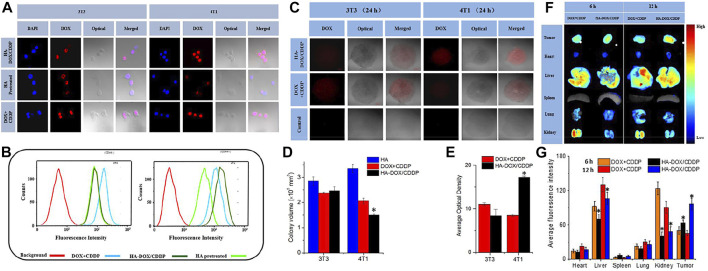
FIGURE 3.
In vitro cellular uptake and intracellular DOX release in 3T3 and 4T1 cells. (A) Confocal laser scattering microscopy and (B) FCM analysis were performed on 3T3 and 4T1 cells following HA pretreatment, and treatment with free DOX + CDDP and HA-DOX-CDDP. In vitro multicellular spheroids in 3D suspension cultures. (C) Confocal laser scattering microscopy of 4T1 and 3T3 cell spheroids treated with HA, DOX + CDDP, and HA-DOX-CDDP for 24 h. (D) Colony volume and (E) fluorescence density analyses of 4T1 and 3T3 cell spheroids treated with HA, DOX + CDDP, and HA-DOX-CDDP for 24 h (*p < 0.05 compared with the DOX + CDDP group). In vivo DOX biodistribution. (F) Ex vivo fluorescence images of isolated organs and tumors at 6 or 12 h post-injection. (G) Semi-quantitative analysis of the mean fluorescence intensity in isolated organs and tumors at 6 or 12 h post-injection. Data are presented as the mean ± SD (n = 3) (*p < 0.05 compared with the DOX + CDDP group). Reproduced with permission from ref (Owen et al., 2012). CC BY 4.0. Copyright 2020 The Authors.

