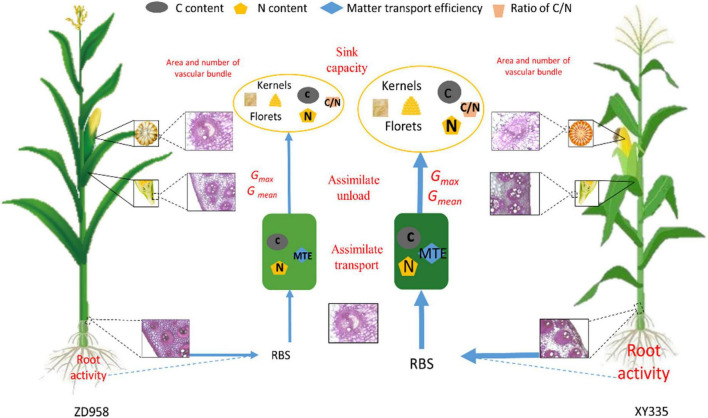
FIGURE 5.
Schematic from this study showing the differences in filling parameters and the response of vascular bundle structure, matter transportation, and source–sink relationship on N input levels between maize varieties ZD958 and XY335. RBS, root bleeding sap; MTE, matter transport efficiency; Gmean and Gmax, mean and maximum grain filling rate; GY, grain yield. Different sizes of the same letter represent value differences.

