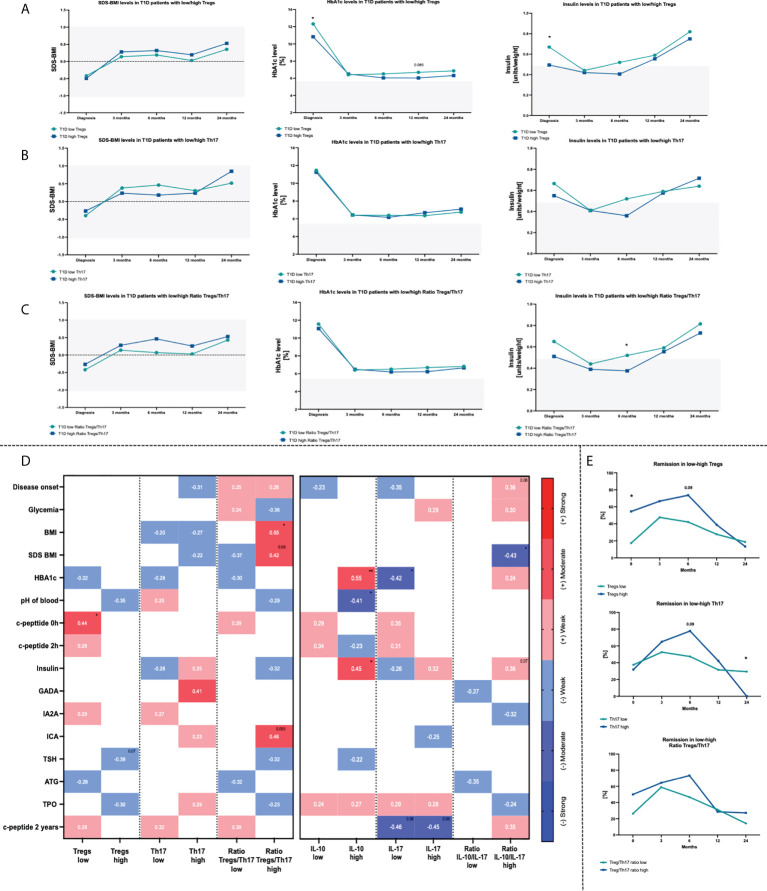
Figure 2.
Influence of Treg and Th17 cells level on changes within HbA1c, SDS-BMI and Insulin dosage. Time-related variations in selected parameters in context of Treg (A), Th17 (B) cells and Treg/Th17 ratio (C). Correlations between Treg/Th17 cells or related plasma cytokines (IL-10/IL-17A) and diagnostic data (D). Frequency of T1D children in remission state depending on the initial Treg or Th17 cells numbers (E). Heat-maps demonstrate r values with exact values and color indicating strength subgroup. The levels of significant differences were indicated with asterisks or exact p values: * - p < 0.05; ** - p < 0.01.

