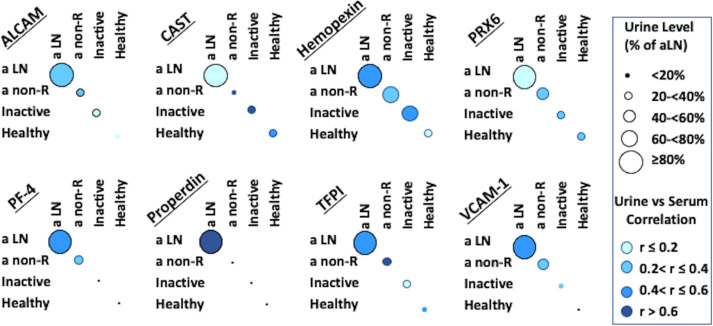
Figure 2.
Correlation of Serum and Urine protein biomarkers in SLE patients and controls. For each subject, the corresponding values of the protein in urine and serum were considered, in order to ascertain any correlation between these 2 measures. Intensity of blue color represents the strength of serum/urine correlations in each of the 4 subject groups examined, while the size of the circles represents urine biomarker level in each group compared to the level in the active LN group; in all cases the biomarker level in active LN was set to be 100%, corresponding to the maximal circle size.

