-
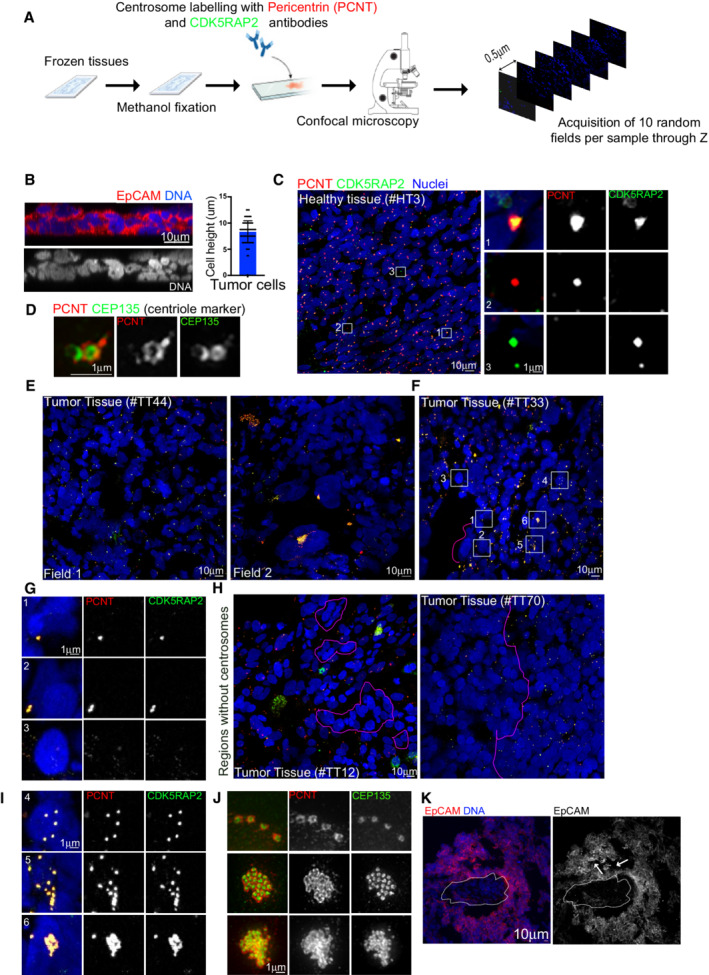
A
Schematic diagram of the workflow used to analyze ovarian tissue sections.
-
B
Left, orthogonal view of a 20 μm tumor section labeled with antibodies against EpCAM (in red) and DNA in blue. Right, dot plot bar representing cell heights in cells from tumor sections, n = 60 cells from 1 tumor. Mean ± SD.
-
C
On the left, images of low magnification views of healthy tissues labeled with antibodies against pericentrin (PCNT) and CDK5RAP2, shown in red and green, respectively. DNA in blue. The white dashed squares represent the regions shown in higher magnifications on the right. One centrosome was considered as such when PCNT and CDK5RAP2 signals co‐localized (Inset 1). Lack of co‐localization (Insets 2 and 3) was noticed and discarded during quantification.
-
D
Super‐resolution microscopy of healthy tissues labeled for the centriole marker CEP135 (in green) and PCNT (in red).
-
E, F
Representative images of two different fields of the same tumor (E) and of a tumor section to highlight different centrosome phenotypes, labeled as described in (C). The pink dashed line highlights an area of cells without centrosomes. The white‐dashed squares represent the regions shown in higher magnifications in insets in (G and I) and the pink dashed line surrounds nuclei without centrosomes.
-
G
Insets from (F).
-
H
Examples of tumor sections showing small (left) and large (right) regions with nuclei without centrosomes.
-
I
Insets from (F) showing different types of centrosome amplification events.
-
J
Super‐resolution microscopy of tumor tissues labeled as in (C).
-
K
Maximum Z‐projection of a tumor section labeled with EpCAM antibodies (Red) and DNA in blue. The dashed line shows the absence of EpCAM staining, arrows show a disorganized region.