
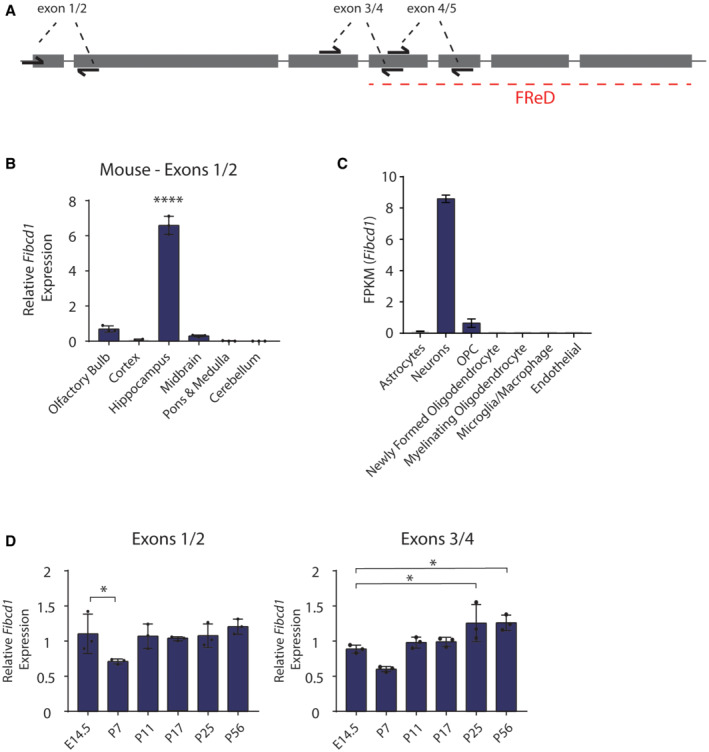
Figure EV1. Fibcd1 expression in the adult and developing mouse brain.
-
ASchematic of mouse Fibcd1 exons (grey rectangles), introns (grey lines) and location of primer pair binding (“exons 1/2, 3/4 and 4/5”) used for RT–qPCR. Exon sizes are to scale; introns and primers are not. The exons coding for FIBCD1 FReD is indicated by a red dashed line.
-
BRelative mRNA expression levels of mouse Fibcd1 (primers binding to exon 1 and 2) normalised to Gapdh in the indicated brain regions, analysed by RT–qPCR (n = 3).
-
CFibcd1 expression in bulk populations of sorted mouse brain cell population, from brainrnaseq.org. OPC, oligodendrocyte precursor cell.
-
DRelative mRNA expression levels of mouse Fibcd1 (primers binding to exons 1 and 2 and exons 3 and 4) normalised to Gapdh in the hippocampus of the indicated time points, analysed by RT–qPCR (n = 3).
Data information: For panels (B and D), each data point represents an individual mouse. Data are presented as mean, and error bars represent SD. P‐values were calculated by one‐way ANOVA comparing each sample with the hippocampus region (B) or the time point E14.5 (D). *P < 0.05; ****P < 0.0001.