
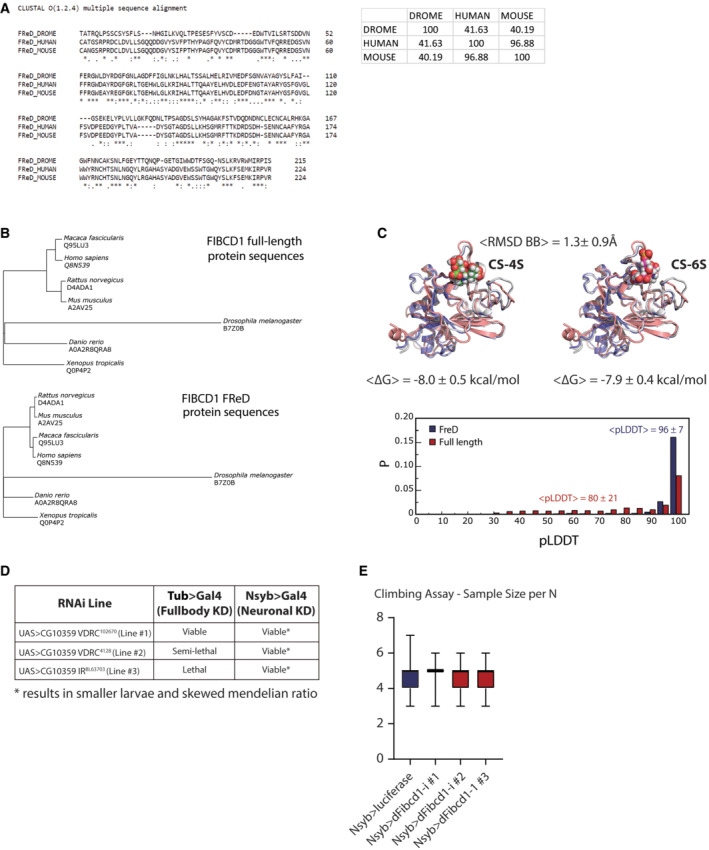
Figure EV2. Description of dFibcd1 .
-
AAlignment of fly (DROME), human and mouse FReD protein sequences. Inset shows percent identity matrix (% homology) between fly, human and mouse FReD protein sequences.
-
BPhylogenetic trees based on multiple‐sequence alignments of either full‐length FIBCD1 (upper) or FReD amino acid sequences (lower) for the six species with available AlphaFold structures and D. melanogaster (AlphaFold structure predicted de novo).
-
CUpper, 3D structures of FReD as predicted by AlphaFold for human (H. sapiens, blue), mouse (M. musculus, grey) and fly (D. melanogaster, pink) with CS‐4S (left) and CS‐6S (right) docked to the human variant. The average pairwise backbone RMSD and standard deviation over all possible pairs chosen from among the seven species studied are indicated above the structures. The average predicted binding free energies and standard deviations between FReD and CS‐4S (left) or CS‐6S (right) over all seven species studied are given below the structures. Lower, distributions of AlphaFold predicted local distance difference test (pLDDT) scores for predictions of either full‐length FIBCD1 or FReD alone pooled over all seven species studied. The high confidence of the FReD structure predictions is reflected in the extreme value of the average pLDDT score (96 ± 7).
-
DSummary of 3 D. melanogaster RNAi lines crossed to full body GAL4 driver (tubulin) or neuron‐specific (Nsyb) and the effects on viability.
-
ENumber of flies analysed for the climbing assay in Fig 2D. Box plots depict data mean and upper and lower quartile; whiskers are the minimum and maximum number