
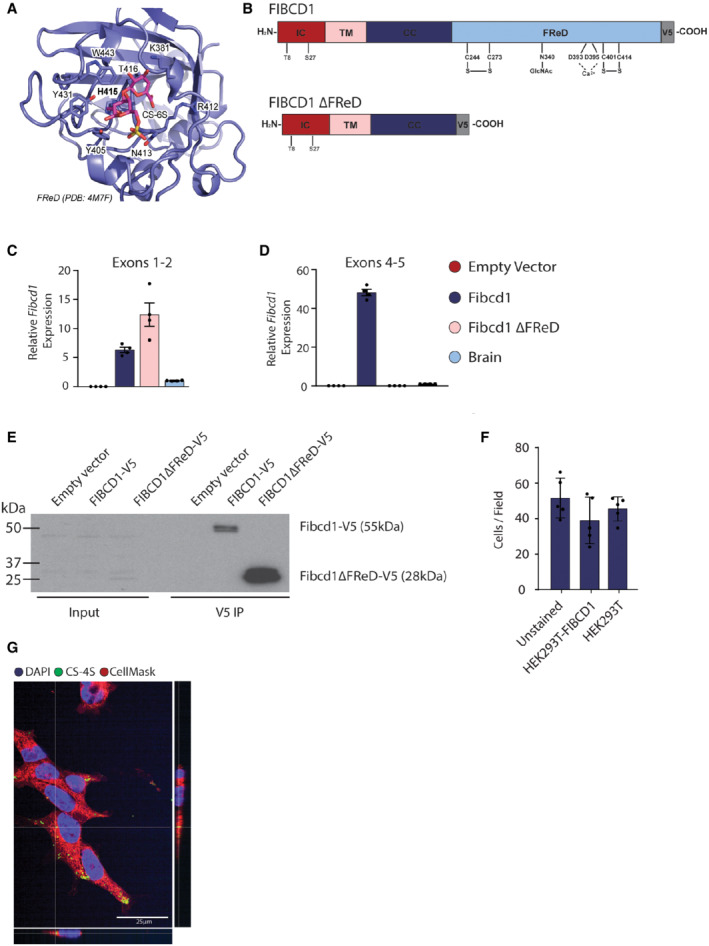
Figure EV4. Docking site of CS‐6S in FIBCD1 FReD and validation of mFIBCD1 overexpressing N2a cell lines.
-
ATop binding pose for in silico docking of CS‐6S to FIBCD1 FReD (PDB 4M7F).
-
BSchematic representation of FIBCD1 domains, IC, intracellular domain (red); TM, transmembrane domain (pink); CC, coiled‐coil domain (dark blue); FReD (light blue); and location of V5‐tag (grey) in full‐length mFIBCD1 cDNA and truncated mFIBCD1 lacking the FReD (FIBCD1 ΔFReD).
-
C, DRelative mRNA expression levels of Fibcd1 in the N2a cells overexpressing full‐length (Fibcd1) or truncated FIBCD1 (Fibcd1 ΔFReD) and adult mouse WT brain for comparison, analysed by RT–qPCR (n = 4) using primers binding to exons 1 and 2 before the FReD domain (C) or to exons 4 and 5 spanning the sequence encoding part of the FReD (D). Note the complete absence of endogenous Fibcd1 expression in the “empty vector” (red bar) control and the complete absence of expression when using primers complementary to exon 4/5 (D), which span the FReD (see Fig EV1A) in the Fibcd1 ΔFReD construct (C, pink bar), validating the generated cell lines. Gapdh was used as housekeeping control, and values obtained from a control brain sample were set to 1.
-
EValidation of transgenic N2a cell line at the protein level by immunoprecipitation with anti‐V5 antibody as bait. Input (left) and V5‐immunoprecipitated (right) lysates from N2a cells expressing V5‐tagged full‐length mFIBCD1 (mFIBCD1‐V5, predicted size of 55 kDa), V5‐tagged mFIBCD1 lacking the FReD (V5‐FIBCD1 ΔFReD, predicted size of 28 kDa) or the empty vector as negative control. Protein marker sizes are indicated.
-
FNumber of HEK293T cells per field during the CS‐4S internalisation experiments, linked to Fig 4F (n = 5).
-
GRepresentative immunofluorescent images of HEK293T‐FIBCD1 cells stained with FITC‐CS‐4S (green), CellMask (red) and Hoechst (blue); bottom and right panels are orthogonal views. Scale bar = 25 μm.
Data information: For panels (C, D and F), each data point represents an individual cell preparation and data are plotted as mean with error bars representing SD.