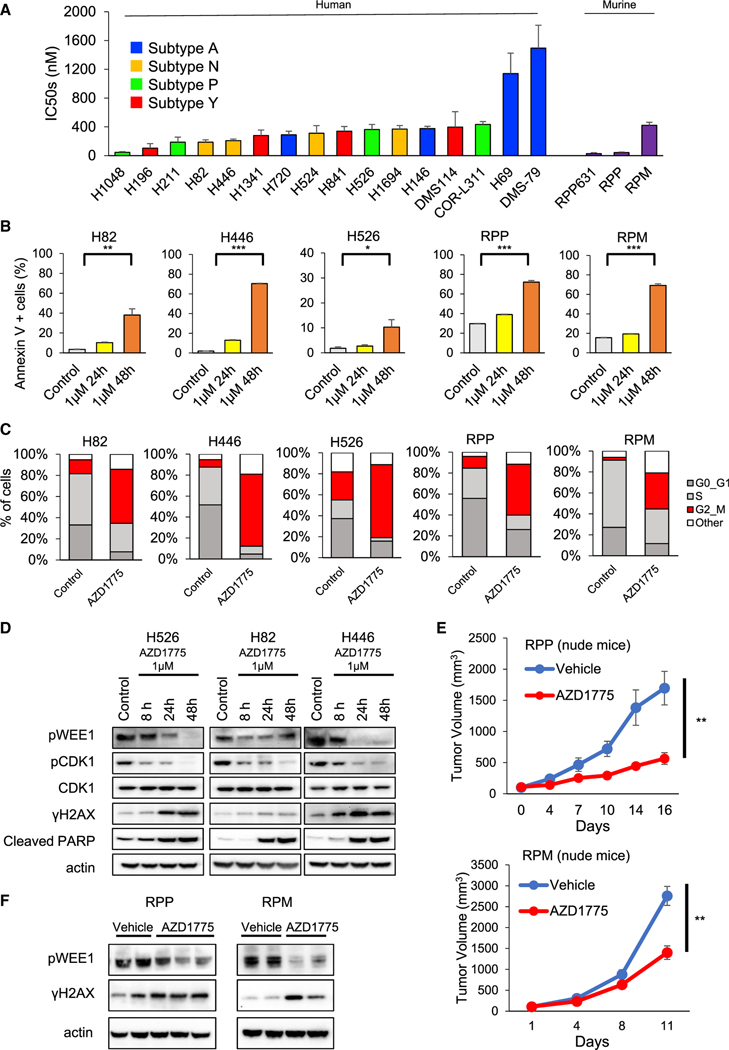
Figure 1. The antitumor effect of AZD1775 in SCLC.
(A) Cell viability IC50 values were determined in response to treatment with AZD1775 (0–10 μM) for 5 days in 16 human and three murine SCLC cell lines. The data shown represent the means ± SD of three individual experiments.
(B) Cells were treated with 1 μM AZD1775 for 24 or 48 h. Then, the proportion of apoptotic cells was detected using annexin V-propidium iodide-based flow cytometry. Bars represent mean ± SD of triplicate. Statistical significance was determined using Student’s t test (**p < 0.01, ***p < 0.001).
(C) Cells were treated with 1 μM AZD1775 for 16 h. Cell-cycle states were detected with EdU-DAPI-based flow cytometry.
(D) Cells were treated with 1 μM AZD1775 for 8, 24, or 48 h. Western blots show protein expression of phospho-WEE1, phospho- and total CDK1, γH2AX, cleaved PARP, and actin (loading control) at each time indicated.
(E) Tumor-growth curves of subcutaneous tumors in nude mice with conditional loss of Trp53, p130, and Rb1 (RPP; top) and Trp53, Rb1, and MYCT58A (RPM; bottom) treated with vehicle or 60 mg/kg of AZD1775 (n = 5 per group). Bars represent mean ± SE. Statistical significance was determined using Student’s t test (**p < 0.01).
(F) Western blots showing phosho-WEE1, γH2AX, and actin (loading control) of RPP or RPM tumors from (E).
See also Figure S1.

