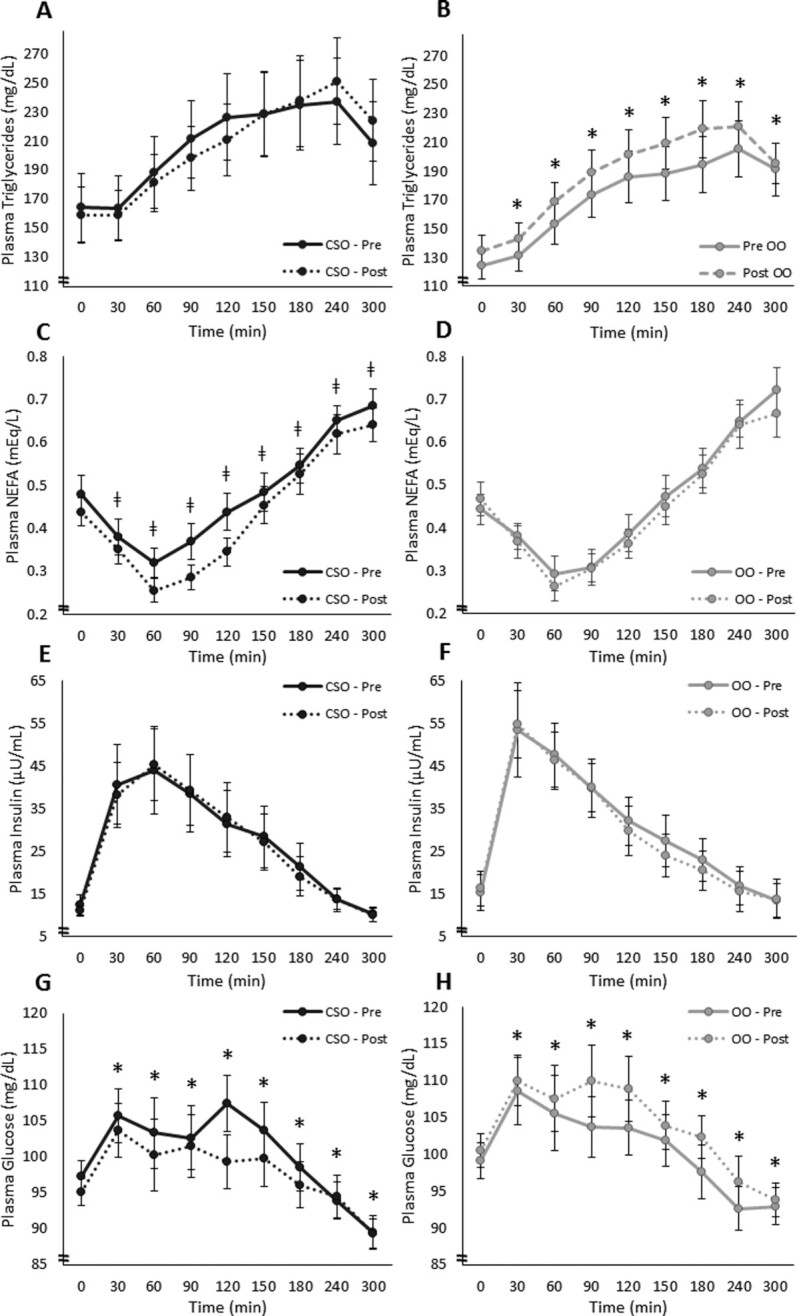
FIGURE 4.

Time course for (A, B) plasma TGs, (C, D) NEFAs, (E, F) insulin, and (G, H) glucose for each treatment at pre- and postintervention visits in adults with hypercholesterolemia (CSO, n = 21; OO, n = 21). Participants consumed a high–saturated fat breakfast meal immediately after time 0. *Significant treatment × visit interaction and a difference between the pre- and postintervention meal responses within a group (P < 0.05). ǂTrend for treatment × visit interaction and a difference between the pre- and postintervention meal responses within a group (P = 0.10). All values are presented as means ± SEMs. Preintervention visits were at week 0 and postintervention visits were at week 8. CSO, cottonseed oil; NEFA, nonesterified fatty acid; OO, olive oil; Post, postintervention; Pre, preintervention; TG, triglyceride.
