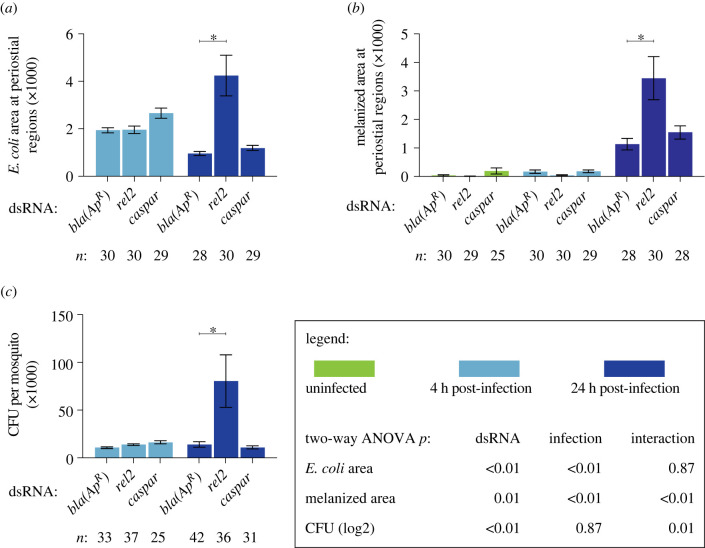
Figure 3.
The IMD pathway modulates immune responses on the heart and the systemic antimicrobial response. (a–c) Graphs for dsbla(ApR), dsrel2 and dscaspar mosquitoes that were not infected or had been infected with GFP-E. coli for 4 or 24 h. The graphs show: (a) pixel area of GFP-E. coli in the periostial regions; (b) pixel area of melanin in the periostial regions; and (c) the systemic GFP-E. coli infection intensity. Graphs show the mean and s.e.m. The data were analysed by two-way ANOVA (bottom box), followed by Dunnett's multiple comparison test. n indicates sample size. Asterisks in graphs indicate post hoc p < 0.05.

