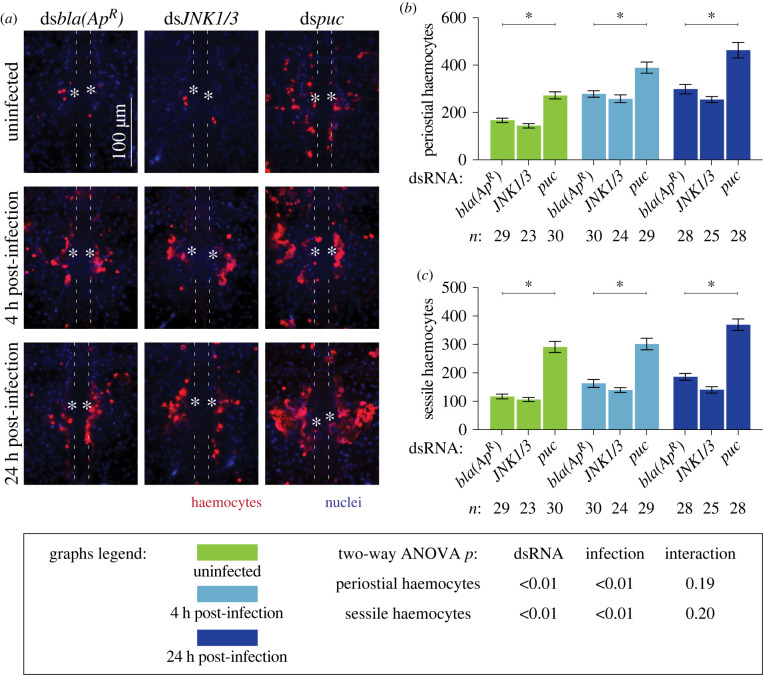
Figure 4.
The JNK pathway drives periostial haemocyte aggregation. (a) Fluorescence images show periostial haemocytes (CM-DiI; red) surrounding a single pair of ostia (asterisks) on a segment of the heart (outlined by dotted lines) of dsbla(ApR), dsJNK1/3 and dspuc mosquitoes that were not infected or had been infected with GFP-E. coli for 4 or 24 h. Anterior is on top. (b,c) Graphs for dsbla(ApR), dsJNK1/3 and dspuc mosquitoes that were not infected or had been infected with GFP-E. coli for 4 or 24 h. The graphs show: (b) average number of periostial haemocytes; and (c) average number of sessile haemocytes outside of the periostial regions in the tergum of abdominal segments 4 and 5. Graphs show the mean and s.e.m. The data were analysed by two-way ANOVA (bottom box), followed by Dunnett's multiple comparison test. n indicates sample size. Asterisks in graphs indicate post hoc p < 0.05.

